6 posts found
Artificial Intelligence applied to the identification and classification of diseases detected by radiodiagnosis
In this post we have described step-by-step a data science exercise in which we try to train a deep learning model with a view to automatically classifying medical images of healthy and sick people.
Diagnostic imaging has been around for many years in the hospitals of develo…
Data documentation: Datasheets for datasets
16.5 billion euros. These are the revenues that artificial intelligence (AI) and data are expected to generate in Spanish industry by 2025, according to what was announced last February at the IndesIA forum, the association for the application of artificial intelligence in industry. AI is alre…
Hercules-ASIO Initiative. Integration, publication and consultation of linked open research data.
The Hercules initiative was launched in November 2017, through an agreement between the University of Murcia and the Ministry of Economy, Industry and Competitiveness, with the aim of developing a Research Management System (RMS) based on semantic open data that offers a global view of the research…
Low coding tools for data analysis
The democratisation of technology in all areas is an unstoppable trend. With the spread of smartphones and Internet access, an increasing number of people can access high-tech products and services without having to resort to advanced knowledge or specialists. The world of data is no stranger to thi…
Data vocabularies: why are they important?
Each individual, organization or group uses a number of common words in their daily communication, which would be their personal vocabularies. The greater the number of words we use, the greater our ability to communicate, but it can also be a barrier, increasing the difficulty of understanding othe…
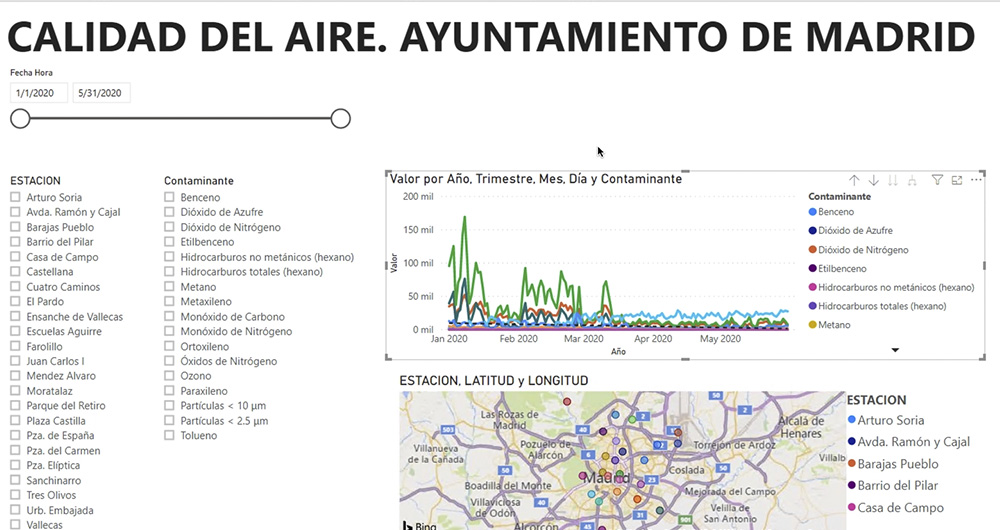
What is an interactive display? Here is an example
The visual representation of data helps our brain to digest large amounts of information quickly and easily. Interactive visualizations make it easier for non-experts to analyze complex situations represented as data.
As we introduced in our last post on this topic, graphical data visualization is a…


