


Documentation
Type
- (-) Remove Data science exercises filter Data science exercises (17)
Authorship
- (-) Remove Aporta initiative filter Aporta initiative (17)
Document date
Tag
-
Chatting with Public Data: A Practical Application of Artificial Intelligence

Open data portals are an invaluable source of public information. However, extracting meaningful insights from this data can be challenging for users without advanced technical knowledge. In this practical exercise, we will explore the development of...
-
Word Embeddings - Practical Exercise on Tag Processing

Open data portals play a fundamental role in accessing and reusing public information. A key aspect in these environments is the tagging of datasets, which facilitates their organization and retrieval. Word embeddings represent a transformative...
-
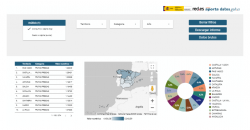
Tourism in Spain: Analyzing National Tourist Flows Using Interactive Visualizations

1. Introduction Visualizations are graphical representations of data that allow for the simple and effective communication of information linked to them. The possibilities for visualization are very broad, from basic representations such as line...
-
How to Create an Expert Assistant with Open Data: Building GPT to Answer the Critical Minerals Challenge
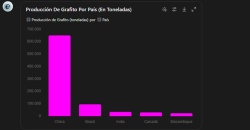
1. Introduction In the information age, artificial intelligence has proven to be an invaluable tool for a variety of applications. One of the most incredible manifestations of this technology is GPT (Generative Pre-trained Transformer),...
-
Road to electrification: Deciphering electric vehicle growth in Spain through data analytics
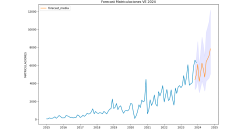
1. Introduction Visualisations are graphical representations of data that allow to communicate, in a simple and effective way, the information linked to the data. The visualisation possibilities are very wide ranging, from basic representations such...
-
Predictive analisys of electric consuption in the city of Barcelona
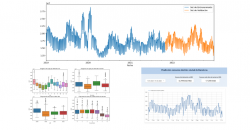
1. Introduction Visualizations are graphical representations of data that allow you to communicate, in a simple and effective way, the information linked to it. The visualization possibilities are very extensive, from basic representations such as...
-
Analysis of travel networks in BICIMAD
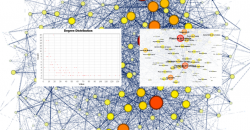
1. Introduction Visualizations are graphical representations of data that allow the information linked to them to be communicated in a simple and effective way. The visualization possibilities are very wide, from basic representations, such as line,...
-
Study on nutrition in spanish homes
1. Introduction Visualizations are graphical representations of data that allow the information linked to them to be communicated in a simple and effective way. The visualization possibilities are very wide, from basic representations, such as line,...
-
Analysis of meteorological data using the "ggplot2" library
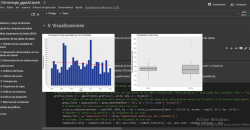
1. Introduction Visualizations are graphical representations of data that allow the information linked to them to be communicated in a simple and effective way. The visualization possibilities are very wide, from basic representations, such as a line...
-
Generating personalized tourist map with "Google My Maps"
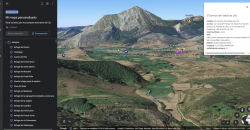
1. Introduction 2. Objective 3. Resources 3.1. Datasets 3.2. Tools 4. Data processing and preparation 5. Data enrichment 6. Map visualization 6.1. Map generation with "Google My Maps" 6.2. Personalization of the information to be...


