


Documentation
Type
- Reports and studies (55) Apply Reports and studies filter
- Guides (40) Apply Guides filter
- Data science exercises (18) Apply Data science exercises filter
- Training materials (13) Apply Training materials filter
- Infographics (7) Apply Infographics filter
- Regulations and strategies (7) Apply Regulations and strategies filter
Audience
Authorship
Document date
Tag
-
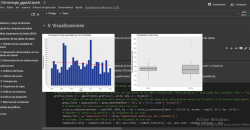
Predictive analisys of electric consuption in the city of Barcelona
1. Introduction Visualizations are graphical representations of data that allow you to communicate, in a simple and effective way, the information linked to it. The visualization possibilities are very extensive, from basic representations such as...
-
Synthetic Data - What are they? And what are they used for?

In the era of data, we face the challenge of a scarcity of valuable data for building new digital products and services. Although we live in a time when data is everywhere, we often struggle to access quality data that allows us to understand processes...
-
Good Practices for Measuring the Impact of Open Data in Europe

The Open Data Maturity Study 2022 provides a snapshot of the level of development of policies promoting open data in countries, as well as an assessment of the expected impact of these policies. Among its findings, it highlights that measuring the impact...
-
Analysis of travel networks in BICIMAD
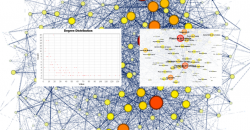
1. Introduction Visualizations are graphical representations of data that allow the information linked to them to be communicated in a simple and effective way. The visualization possibilities are very wide, from basic representations, such as line,...
-
Open Data and Reuse of Public Sector Information in the Judicial Field: Challenges in Regulation, Use Cases, and Opportunities

The digitalization in the public sector in Spain has also reached the judicial field. The first regulation to establish a legal framework in this regard was the reform that took place through Law 18/2011, of July 5th (LUTICAJ). Since then, there have...
-
Study on nutrition in spanish homes
1. Introduction Visualizations are graphical representations of data that allow the information linked to them to be communicated in a simple and effective way. The visualization possibilities are very wide, from basic representations, such as line,...
-
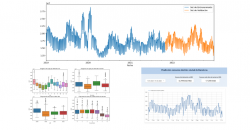
Analysis of meteorological data using the "ggplot2" library
1. Introduction Visualizations are graphical representations of data that allow the information linked to them to be communicated in a simple and effective way. The visualization possibilities are very wide, from basic representations, such as a line...
-
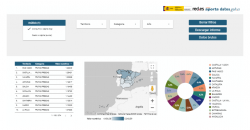
Generating personalized tourist map with "Google My Maps"
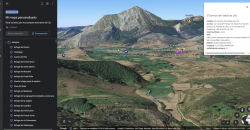
1. Introduction 2. Objective 3. Resources 3.1. Datasets 3.2. Tools 4. Data processing and preparation 5. Data enrichment 6. Map visualization 6.1. Map generation with "Google My Maps" 6.2. Personalization of the information to be...
-
Este informe recoge varias temáticas relevantes para la comunidad europea de datos geoespaciales. Por un lado, el capítulo dedicado a la "modernización INSPIRE y avance hacia los datos abiertos" trata la evaluación realizada por la Comisión Europea de...
-

Dos temáticas principales son tratadas en este informe debido a su importancia para la comunidad europea de datos geoespaciales. Por un lado la "modernización INSPIRE -avanzando hacia los datos abiertos" en la que se trata la evaluación realizada a la...


