


Documentation
-
Analysis of meteorological data using the "ggplot2" library
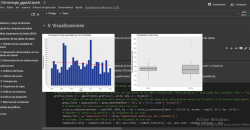
1. Introduction Visualizations are graphical representations of data that allow the information linked to them to be communicated in a simple and effective way. The visualization possibilities are very wide, from basic representations, such as a line...
-
Generating personalized tourist map with "Google My Maps"
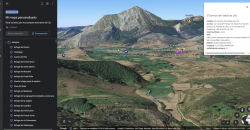
1. Introduction 2. Objective 3. Resources 3.1. Datasets 3.2. Tools 4. Data processing and preparation 5. Data enrichment 6. Map visualization 6.1. Map generation with "Google My Maps" 6.2. Personalization of the information to be...
-
Analysis of toxicological findings in road traffic accidents
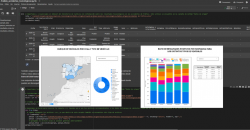
1. Introduction 2. Objetive 3. Resources 3.1. Datasets 3.2. Tools 4. Data processing or preparation 5. Generating visualizations 5.1. Fleet of vehicles registered by Autonomous Communities and by type of vehicle 5.2. Ratio of...
-
Analysis of the state and evolution of the national water reservoirs

1. Introduction 2. Objetives 3. Resources 3.1. Datasets 3.2. Tools 4. Data enrichment 5. Data pre-processing 6. Data visualization 6.1. Geographic location and main information on each reservoir 6.2. Water reserve between the years...
-
Characteristics of the Spanish University students and most demanded degrees

1. Introduction 2. Objetives 3. Resources 3.1. Datasets 3.2. Tools 4. Data pre-processing 5. Visualizations 6. Conclusions 1. Introduction Visualizations are graphical representations of data that allow to transmit in a...
-
Creating word clouds from the text data with NLP techniques
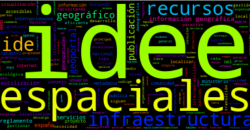
1. Introduction 2. Objetives 3. Resources 3.1. Tools 3.2. Datasets 4. Data processing 5. Creation of the world cloud 6. Conclusions 1. Introduction Visualizations are a graphic representation that allow us to comprehend in...
-
How many accidents occur in the city of Madrid?
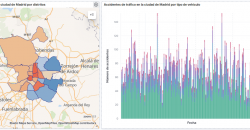
1. Introduction 2. Objetives 3. Resources 3.1. Datasets 3.2. Tools 4. Data processing 5. Visualizations 6. Conclusions 1. Introduction Data visualization is a task linked to data analysis that aims to...
-
Teachers of public schools in Castilla y León
1. Introductionction 2. Objetiveses 3. Resources 3.1. Datasets 3.2. Tools 4. Data processing 5. Visualizationtion 6. Conclusions 1. Introduction Data visualization is a task linked to data analysis that aims to...
-
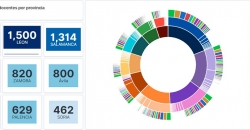
Characterization of the employment demand and registered contracting in Spain

1. Introductiontion 2. Objetiveses 3. Resources 3.1. Datasets 3.2. Tools 4. Data processing 5. Visualizations 6. Conclusionss 1. Introduction Data visualization is a task linked to data analysis...


