Blog
2023 was a year full of new developments in artificial intelligence, algorithms and data-related technologies. Therefore, these Christmas holidays are a good time to take advantage of the arrival of the Three Wise Men and ask them for a book to enjoy reading during the holidays, the well-deserved rest and the return to routine after the holiday period.
Whether you are looking for a reading that will improve your professional profile, learn about new technological developments and applications linked to the world of data and artificial intelligence, or if you want to offer your loved ones a didactic and interesting gift, from datos.gob.es we want to offer you some examples. For the elaboration of the list we have counted on the opinion of experts in the field.
Take paper and pencil because you still have time to include them in your letter to the Three Wise Men!
1. Inteligencia Artificial: Ficción, Realidad y... sueños, Nuria Oliver, Real Academia de Ingeniería GTT (2023)
What it’s about: The book has its origin in the author's acceptance speech to the Royal Academy of Engineering. In it, she explores the history of AI, its implications and development, describes its current impact and raises several perspectives.
Who should read it: It is designed for people interested in entering the world of Artificial Intelligence, its history and practical applications. It is also aimed at those who want to enter the world of ethical AI and learn how to use it for social good.
2. A Data-Driven Company. 21 Claves para crear valor a través de los datos y de la Inteligencia Artificial, Richard Benjamins, Lid Editorial (2022)
What it's about: A Data-Driven Company looks at 21 key decisions companies need to face in order to become a data-driven, AI-driven enterprise. It addresses the typical organizational, technological, business, personnel, business, and ethical decisions that organizations must face to start making data-driven decisions, including how to fund their data strategy, organize teams, measure results, and scale.
Who should read it: It is suitable for professionals who are just starting to work with data, as well as for those who already have experience, but need to adapt to work with big data, analytics or artificial intelligence.
3. Digital Empires: The Global Battle to Regulate Technology, Anu Bradford, OUP USA (2023)
What it's about: In the face of technological advances around the world and the arrival of corporate giants spread across international powers, Bradford examines three competing regulatory approaches: the market-driven U.S. model, the state-driven Chinese model, and the rights-based European regulatory model. It examines how governments and technology companies navigate the inevitable conflicts that arise when these regulatory approaches clash internationally.
Who should read it: This is a book for those who want to learn more about the regulatory approach to technologies around the world and how it affects business. It is written in a clear and understandable way, despite the complexity of the subject. However, the reader will need to know English, because it has not yet been translated into Spanish.
4. El mito del algoritmo, Richard Benjamins e Idoia Salazar, Anaya Multimedia (2020)
What it's about: Artificial intelligence and its exponential use in multiple disciplines is causing an unprecedented social change. With it, philosophical thoughts as deep as the existence of the soul or debates related to the possibility of machines having feelings are beginning to emerge. This is a book to learn about the challenges, challenges and opportunities of this technology.
Who should read it: It is aimed at people with an interest in the philosophy of technology and the development of technological advances. By using simple and enlightening language, it is a book within the reach of a general public.
5. ¿Cómo sobrevivir a la incertidumbre?, de Anabel Forte Deltell, Next Door Publishers
What it is about: It explains in a simple way and with examples how statistics and probability are more present in daily life. The book starts from the present day, in which data, numbers, percentages and graphs have taken over our daily lives and have become indispensable for making decisions or for understanding the world around us.
Who should read it: A general public that wants to understand how the analysis of data, statistics and probability are shaping a large part of political, social, economic and social decisions?
6. Análisis espacial con R: Usa R como un Sistema de Información Geográfica, Jean François Mas, European Scientific Institute
What it is about: This is a more technical book, which provides a brief introduction to the main concepts for handling the R programming language and environment (types of objects and basic operations) and then introduces the reader to the use of the sf library or package for spatial data in vector format through its main functions for reading, writing and analysis. The book approaches, from a practical and applicative perspective with an easy-to-understand language, the first steps to get started with the use of R in spatial analysis applications; for this, it is necessary that users have basic knowledge of Geographic Information Systems.
Who should read it: A public with some knowledge of R and basic knowledge of GIS who wish to enter the world of spatial analysis applications.
This is just a small sample of the great variety of existing literature related to the world of data. We are sure that we have left some interesting book without including it, so if you have any extra recommendation you would like to make, do not hesitate to leave us your favorite title in the comments. Those of us on the datos.gob.es team would be delighted to read your recommendations.
Blog
We are currently in the midst of an unprecedented race to master innovations in Artificial Intelligence. Over the past year, the star of the show has been Generative Artificial Intelligence (GenAI), i.e., that which is capable of generating original and creative content such as images, text or music. But advances continue to come and go, and lately news is beginning to arrive suggesting that the utopia of Artificial General Intelligence (AGI) may not be as far away as we thought. We are talking about machines capable of understanding, learning and performing intellectual tasks with results similar to those of the human brain.
Whether this is true or simply a very optimistic prediction, a consequence of the amazing advances achieved in a very short space of time, what is certain is that Artificial Intelligence already seems capable of revolutionizing practically all facets of our society based on the ever-increasing amount of data used to train it.
And the fact is that if, as Andrew Ng argued back in 2017, artificial intelligence is the new electricity, open data would be the fuel that powers its engine, at least in a good number of applications whose main and most valuable source is public information that is accessible for reuse. In this article we will review a field in which we are likely to see great advances in the coming years thanks to the combination of artificial intelligence and open data: artistic creation.
Generative Creation Based on Open Cultural Data
The ability of artificial intelligence to generate new content could lead us to a new revolution in artistic creation, driven by access to open cultural data and a new generation of artists capable of harnessing these advances to create new forms of painting, music or literature, transcending cultural and temporal barriers.
Music
The world of music, with its diversity of styles and traditions, represents a field full of possibilities for the application of generative artificial intelligence. Open datasets in this field include recordings of folk, classical, modern and experimental music from all over the world and from all eras, digitized scores, and even information on documented music theories. From the arch-renowned MusicBrainz, the open music encyclopedia, to datasets opened by streaming industry dominators such as Spotify or projects such as Open Music Europe, these are some examples of resources that are at the basis of progress in this area. From the analysis of all this data, artificial intelligence models can identify unique patterns and styles from different cultures and eras, fusing them to create unpublished musical compositions with tools and models such as OpenAI's MuseNet or Google's Music LM.
Literature and painting
In the realm of literature, Artificial Intelligence also has the potential to make not only the creation of content on the Internet more productive, but to produce more elaborate and complex forms of storytelling. Access to digital libraries that house literary works from antiquity to the present day will make it possible to explore and experiment with literary styles, themes and storytelling archetypes from diverse cultures throughout history, in order to create new works in collaboration with human creativity itself. It will even be possible to generate literature of a more personalized nature to the tastes of more minority groups of readers. The availability of open data such as the Guttemberg Project with more than 70,000 books or the open digital catalogs of museums and institutions that have published manuscripts, newspapers and other written resources produced by mankind, are a valuable resource to feed the learning of artificial intelligence.
The resources of the Digital Public Library of America1 (DPLA) in the United States or Europeana in the European Union are just a few examples. These catalogs not only include written text, but also vast collections of visual works of art, digitized from the collections of museums and institutions, which in many cases cannot even be admired because the organizations that preserve them do not have enough space to exhibit them to the public. Artificial intelligence algorithms, by analyzing these works, discover patterns and learn about artistic techniques, styles and themes from different cultures and historical periods. This makes it possible for tools such as DALL-E2 or Midjourney to create visual works from simple text instructions with aesthetics of Renaissance painting, Impressionist painting or a mixture of both.
However, these fascinating possibilities are accompanied by a still unresolved controversy about copyright that is being debated in academic, legal and juridical circles and that poses new challenges to the definition of authorship and intellectual property. On the one hand, there is the question of the ownership of rights over creations produced by artificial intelligence. On the other hand, there is the use of datasets containing copyrighted works that have been used in the training of models without the consent of the authors. On both issues there are numerous legal disputes around the world and requests for explicit removal of content from the main training datasets.
In short, we are facing a field where the advance of artificial intelligence seems unstoppable, but we must be very aware not only of the opportunities, but also of the risks involved.
Content prepared by Jose Luis Marín, Senior Consultant in Data, Strategy, Innovation & Digitalization. The contents and points of view reflected in this publication are the sole responsibility of its author.
Blog
Data activism is an increasingly significant citizen practice in the platform era for its growing contribution to democracy, social justice and rights. It is an activism that uses data and data analysis to generate evidence and visualisations with the aim of revealing injustices, improving people's lives and promoting social change.
In the face of the massive use of surveillance data by certain corporations, data activism is exercised by citizens and non-governmental organisations. For example, the organisation Forensic Architecture (FA)a centre at Goldsmiths under the University of London, investigates human rights violations, including state violence, using public, citizen and satellite data, and methodologies such as open source intelligence (known as OSINT). The analysis of data and metadata, the synchronisation of video footage taken by witnesses or journalists, as well as official recordings and documents, allows for the reconstruction of facts and the generation of an alternative narrative about events and crises.
Data activism has attracted the interest of research centres and non-governmental organisations, generating a line of work within the discipline of critical studies. This has allowed us to reflect on the effect of data, platforms and their algorithms on our lives, as well as on the empowerment that is generated when citizens exercise their right to data and use it for the common good.

Image 1: Ecocide in Indonesia (2015)
Source: Forensic Architecture (https://forensic-architecture.org/investigation/ecocide-in-indonesia)
Research centres such as Datactive o Data + Feminism Lab have created theory and debates on the practice of data activism. Likewise, organisations such as Algorights -a collaborative network that encourages civil society participation in the field of aI technologies- y AlgorithmWatch -a human rights organisation - generate knowledge, networks and arguments to fight for a world in which algorithms and artificial Intelligence (AI) contribute to justice, democracy and sustainability, rather than undermine them.
This article reviews how data activism emerged, what interest it has sparked in social science, and its relevance in the age of platforms.
History of a practice
The production of maps using citizen data could be one of the first manifestations of data activism as it is now known. A seminal map in the history of data activism was generated by victims and activists with data from the 2010 Haiti earthquakeon the Kenyan platform Ushahidi ("testimony" in Swahili). A community of digital humanitarianscreated the map from other countries and called on victims and their families and acquaintances to share data on what was happening in real time. Within hours, the data was verified and visualised on an interactive map that continued to be updated with more data and was instrumental in assisting the victims on the ground. Today, such mapsare generated whenever a crisis arises, and are enriched with citizen, satellite and camera-equipped drone data to clarify events and generate evidence.
Emerging from movements known as cypherpunk and technopositivism or technoptimism (based on the belief that technology is the answer to humanity's challenges), data activism has evolved as a practice to adopt more critical stances towards technology and the power asymmetries that arise between those who originate and hand over their data, and those who capture and analyse it.
Today, for example, the Ushahidi community map production platform has been used to create data on gender-based violence in Egypt and Syria, and on trusted gynaecologists in India, for example. Today, the invisibilisation and silencing of women is the reason why some organisations are fighting for recognition and a policy of visibility, something that became evident with the #MeToo movement. Feminist data practices seek visibility and critical interpretations of datification(or the transformation of all human and non-human action into measurable data that can be transformed into value). For example, Datos Contra el Feminicidio or Feminicidio.net offer maps and data analysis on femicide in various parts of the world.
The potential for algorithmic empowerment offered by these projects removes barriers to equality by improving the conditions conditions that enable women to solve problems, determine how data is collected and used, and exercise power.
Birth and evolution of a concept
In 2015, Citizen Media Meets Big Data: The Rise of Data Activismwas published, in which, for the first time, data activism was coined and defined as a concept based on practices observed in activists who engage politically with data infrastructure. Data infrastructure includes the data, software, hardware and processes needed to turn data into value. Later, Data activism and social change (London, Palgrave) and Data activism and social change. Alliances, maps, platforms and action for a better world (Madrid: Dykinson) develop analytical frameworks based on real cases that offer ways to analyse other cases.
Accompanying the varied practices that exist within data activism, its study is creating spaces for feminist and post-colonialist research on the consequences of datification. Whereas the chroniclers of history (mainly male sources) defined technology in relation to the value of their productsfeminist data studies consider women as users and designers of technology as users and designers of algorithmic systems and seek to use data for equality, and to move away from capitalist exploitation and its structures of domination.
Data activism is now an established concept in social science. For example, Google Scholar offers more than 2,000 results on "data activism". Several researchers use it as a perspective to analyse various issues. For example, Rajão and Jarke explore environmental activism in Brazil; Gezgin studies critical citizenship and its use of data infrastructure; Lehtiniemi and Haapoja explore data agency and citizen participation; and Scott examines the need for platform users to develop digital surveillance and care for their personal data.
At the heart of these concerns is the concept of data agency, which refers to people not only being aware of the value of their data, but also exercising control over it, determining how it is used and shared. It could be defined as actions and practices related to data infrastructure based on individual and collective reflection and interest. That is, while liking a post would not be considered an action with a high degree of data agency, participating in a hackathon - a collective event in which a computer programme is improved or created - would be. Data agency is based on data literacy, or the degree of knowledge, access to data and data tools, and opportunities for data literacy that people have. Data activism is not possible without a data agency.
In the rapidly evolving landscape of the platform economy, the convergence of data activism, digital rights and data agency has become crucial. Data activism, driven by a growing awareness of the potential misuse of personal data, encourages individuals and collectives to use digital technology for social change, as well as to advocate for greater transparency and accountability on the part of tech giants. As more and more data generation and the use of algorithms shape our lives in areas such as education, employment, social services and health, data activism emerges as a necessity and a right, rather than an option.
____________________________________________________________________
Content prepared by Miren Gutiérrez, PhD and researcher at the University of Deusto, expert in data activism, data justice, data literacy and gender disinformation.
The contents and views reflected in this publication are the sole responsibility of its author.
Documentación
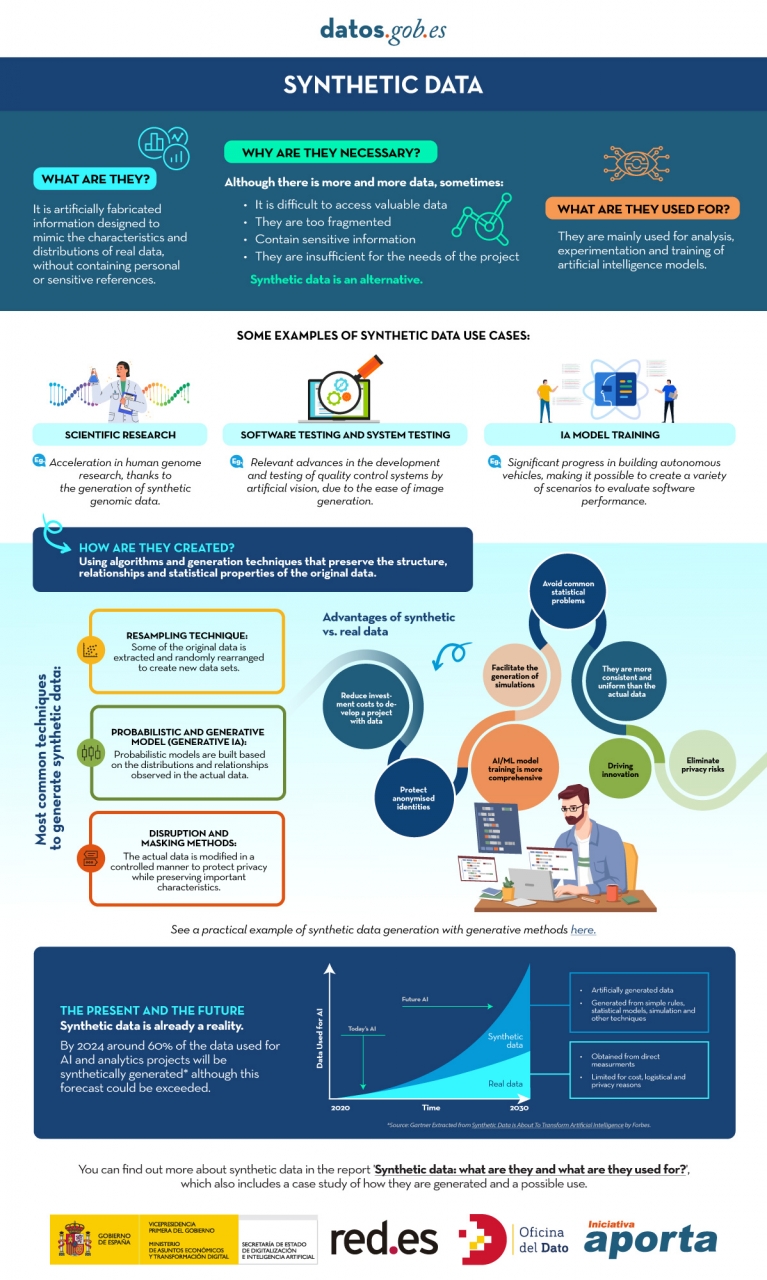
In the era of data, we face the challenge of a scarcity of valuable data for building new digital products and services. Although we live in a time when data is everywhere, we often struggle to access quality data that allows us to understand processes or systems from a data-driven perspective. The lack of availability, fragmentation, security, and privacy are just some of the reasons that hinder access to real data.
However, synthetic data has emerged as a promising solution to this problem. Synthetic data is artificially created information that mimics the characteristics and distributions of real data, without containing personal or sensitive information. This data is generated using algorithms and techniques that preserve the structure and statistical properties of the original data.
Synthetic data is useful in various situations where the availability of real data is limited or privacy needs to be protected. It has applications in scientific research, software and system testing, and training artificial intelligence models. It enables researchers to explore new approaches without accessing sensitive data, developers to test applications without exposing real data, and AI experts to train models without the need to collect all the real-world data, which is sometimes simply impossible to capture within reasonable time and cost.
There are different methods for generating synthetic data, such as resampling, probabilistic and generative modeling, and perturbation and masking methods. Each method has its advantages and challenges, but overall, synthetic data offers a secure and reliable alternative for analysis, experimentation, and AI model training.
It is important to highlight that the use of synthetic data provides a viable solution to overcome limitations in accessing real data and address privacy and security concerns. Synthetic data allows for testing, algorithm training, and application development without exposing confidential information. However, ensuring the quality and fidelity of synthetic data is crucial through rigorous evaluations and comparisons with real data.
In this report, we provide an introductory overview of the discipline of synthetic data, illustrating some valuable use cases for different types of synthetic data that can be generated. Autonomous vehicles, DNA sequencing, and quality controls in production chains are just a few of the cases detailed in this report. Furthermore, we highlight the use of the open-source software SDV (Synthetic Data Vault), developed in the academic environment of MIT, which utilizes machine learning algorithms to create tabular synthetic data that imitates the properties and distributions of real data. We present a practical example in a Google Colab environment to generate synthetic data about fictional customers hosted in a fictional hotel. We follow a workflow that involves preparing real data and metadata, training the synthesizer, and generating synthetic data based on the learned patterns. Additionally, we apply anonymization techniques to protect sensitive data and evaluate the quality of the generated synthetic data.
In summary, synthetic data is a powerful tool in the data era, as it allows us to overcome the scarcity and lack of availability of valuable data. With its ability to mimic real data without compromising privacy, synthetic data has the potential to transform the way we develop AI projects and conduct analysis. As we progress in this new era, synthetic data is likely to play an increasingly important role in generating new digital products and services.
If you want to know more about the content of this report, you can watch the interview with its author.
Below, you can download the full report, the executive summary and a presentation-summary.
Blog
Digital technology and algorithms have revolutionised the way we live, work and communicate. While promising efficiency, accuracy and convenience, these technologies can exacerbate prejudice and social inequalities exacerbate prejudice and social inequalities and create new forms of exclusion and create new forms of exclusion. Thus, invisibilisation and discrimination, which have always existed, take on new forms in the age of algorithms.
Lack of interest and data leads to algorithmic invisibilisation, leading to two types of algorithmic neglect. The first of these is among the world's underserved, which includes the millions who do not have a smartphone or a bank account millions who do not have a smartphone or a bank account, and are thus on the margins of the platform economy and who are therefore on the margins of the platform economy and, for algorithms, do not exist. The second type of algorithmic abandonment includes individuals or groups who are victims of the failure of the algorithmic system, as was the case with SyRI(Systeem Risico Indicatie)SyRI(Systeem Risico Indicatie) in the Netherlands that unfairly singled out some 20,000 families from low socio-economic backgrounds for tax fraud, leading many to ruin by 2021. The algorithm, which the algorithm, which was declared illegal by a court in The Hague months later, was applied in the country's poorest neighbourhoodsthe algorithm, which was declared illegal by a court in The Hague months later, was applied in the country's poorest neighbourhoods the algorithm, which was declared illegal by a court in The Hague months later, was applied in the poorest neighbourhoods of the country and blocked many families with more than one nationality from receiving the social benefits to which they were entitled because of their socio-economic status.
Beyond the example in the Dutch public system, invisibilisation and discrimination can also originate in the private sector. One example is Amazon's amazon's job posting algorithm which showed a bias against women by learning from historical data - i.e. incomplete data because it did not include a large and representative universe - leading Amazon to abandon the project. which showed a bias against women by learning from historical data - i.e. incomplete data because it did not include a large and representative universe - leading Amazon to abandon the project. Another example is Apple Card, a credit card backed by Goldman Sachs, which was also singled out when its algorithm was found to offer more favourable credit limits to men than to women.
In general, invisibility and algorithmic discrimination, in any field, can lead to unequal access to resources and exacerbate social and economic exclusion.
Making decisions based on algorithms
Data and algorithms are interconnected components in computing and information processing. Data serve as a basis, but can be unstructured, with excessive variability and incompleteness. Algorithms are instructions or procedures designed to process and structure this data and extract meaningful information, patterns or results.
The quality and relevance of the data directly impacts the effectiveness of the algorithms, as they rely on the data inputs to generate results. Hence, the principle "rubbish in, rubbish out"which summarises the idea that if poor quality, biased or inaccurate data enters a system or process, the result will also be of poor quality or inaccurate. On the other hand, well-designed well-designed algorithms can enhance the value of data by revealing hidden relationships or making by revealing hidden relationships or making predictions.
This symbiotic relationship underscores the critical role that both data and algorithms play in driving technological advances, enabling informed decision making, and This symbiotic relationship underscores the critical role that both data and algorithms play in driving technological advances, enabling informed decision making, and fostering innovation.
Algorithmic decision making refers to the process of using predefined sets of instructions or rules to analyse data and make predictions to aid decision making. Increasingly, it is being applied to decisions that have to do with social welfare social welfare and the provision of commercial services and products through platforms. This is where invisibility or algorithmic discrimination can be found.
Increasingly, welfare systems are using data and algorithms to help make decisions on issues such as who should receive what kind of care and who is at risk. These algorithms consider different factors such as income, family or household size, expenditures, risk factors, age, sex or gender, which may include biases and omissions.
That is why the That is why the Special Rapporteur on extreme poverty and human rights, Philip Alston, warned in a report to the UN General Assembly that the uncautious adoption of these can lead to dystopian social welfare dystopian social welfare. In such a dystopian welfarestate , algorithms are used to reduce budgets, reduce the number of beneficiaries, eliminate services, introduce demanding and intrusive forms of conditionality, modify behaviour, impose sanctions and "reverse the notion that the state is accountable".
Algorithmic invisibility and discrimination: Two opposing concepts
Although data and algorithms have much in common, algorithmic invisibility and discrimination are two opposing concepts. Algorithmic invisibility refers to gaps in data sets or omissions in algorithms, which result in inattentions in the application of benefits or services. In contrast, algorithmic discrimination speaks to hotspots that highlight specific communities or biased characteristics in datasets, generating unfairness.
That is, algorithmic invisibilisation occurs when individuals or groups are absent from datasets, making it impossible to address their needs. For example, integrating data on women with disabilities into social decision-making can be vital for the inclusion of women with disabilities in society. Globally, women are more vulnerable to algorithmic invisibilisation than men, as they have less access to digital technology have less access to digital technology and leave fewer digital traces.
Opaque algorithmic systems that incorporate stereotypes can increase invisibilisation and discrimination by hiding or targeting vulnerable individuals or populations. An opaque algorithmic system is one that does not allow access to its operation.
On the other hand, aggregating or disaggregating data without careful consideration of the consequences can result in omissions or errors result in omissions or errors. This illustrates the double-edged nature of accounting; that is, the ambivalence of technology that quantifies and counts, and that can serve to improve people's lives, but also to harm them.
Discrimination can arise when algorithmic decisions are based on historical data, which usually incorporate asymmetries, stereotypes and injustices, because more inequalities existed in the past. The "rubbish in, rubbish out" effect occurs if the data is skewed, as is often the case with online content. Also, biased or incomplete databases can be incentives for algorithmic discrimination. Selection biases may arise when facial recognition data, for example, is based on the features of white men, while the users are dark-skinned women, or on online content generated by a minority of agentswhich makes generalisation difficult.
As can be seen, tackling invisibility and algorithmic discrimination is a major challenge that can only be solved through awareness-raising and collaboration between institutions, campaigning organisations, businesses and research.
Content prepared by Miren Gutiérrez, PhD and researcher at the University of Deusto, expert in data activism, data justice, data literacy and gender disinformation.
The contents and views reflected in this publication are the sole responsibility of the author.
Blog
Generative artificial intelligence refers to machine’s ability to generate original and creative content, such as images, text or music, from a set of input data. As far as text generation is concerned, these models have been accessible, in an experimental format, for some time, but began to generate interest in mid-2020 when Open AI, an organisation dedicated to research in the field of artificial intelligence, published access to its GPT-3 language model via an API.
The GPT-3's architecture is composed of 175 billion parameters, comparing to its predecessor GPT-2 was 1.5 billion parameters, i.e. more than 100 times more. Therefore, GPT-3 represents a huge change in scale as it was also trained with a much larger corpus of data and a much larger token size, which allowed it to acquire a deeper and more complex understanding of the human language.
Although it was in 2022 when OpenAI announced the launch of chatGPT, which provides a conversational interface to a language model based on an improved version of GPT-3, it has only been in the last two months that the chat has attracted massive public attention, thanks to extensive media coverage that tries to respond to the emerging general interest.
In fact, ChatGPT is not only able to generate text from a set of characters (prompt) like GPT-3, but also it is able to respond to natural language questions in several languages including English, Spanish, French, German, Italian or Portuguese. This specific updated issue in the access interface from an API to a chatbot that has made the AI accessible to any type of user.
Maybe for this reason, more than a million people registered to use it in just five days, which has led to the multiplication of examples in which chatGPT produces software code, university-level essays, poems and even jokes. Not to mention the fact that it has been able to ace an history SAT or pass the final MBA exam at the prestigious Wharton School.
All of this has put generative AI at the centre of a new wave of technological innovation that promises to revolutionise the way we relate to the internet and the web through AI-powered searches or browsers capable of summarising the results of these searches.
Just a few days ago, we heard the news that Microsoft is working on the implementation of a conversational system within its own search engine, which has been developed based on the well-known Open AI language model and whose news has put Google in check.
As a result of this new reality in which AI is here to stay, the technological giants have gone a step further in the battle to make the most of the benefits it brings. Along these lines, Microsoft has presented a new strategy aimed at optimising the way in which we interact with the internet, introducing AI to improve the results offered by browser search engines, applications, social networks and, in short, the entire web ecosystem.
However, although the path in the development of new and future services offered by Open AI's remains to be seen, advances such as the mentioned above, offer a small hint of the browser war that is coming and that will probably change the way we create and find content on the web in the short term.
The open data
GPT-3, like other models that have been generated with the techniques described in the original GTP-3 scientific publication, is a pre-trained language model, which means that it has been trained with a large dataset, in total about 45 terabytes of text data. According to the paper, the training dataset was composed of 60% of data obtained directly from the internet containing millions of documents of all kinds, 22% from the WebText2 corpus built from Reddit, and the rest from a combination of books (16%) and Wikipedia (3%).
However, it is not known exactly how much open datasets GPT-3 uses, as OpenAI does not provide more specific details about the dataset used to train the model. What we can ask chatGPT itself are some questions that can help us draw interesting conclusions about its use of open data.
For example, if we ask chatGPT what was the population of Spain between 2015 and 2020 (we cannot ask for more recent data), we get an answer like this:
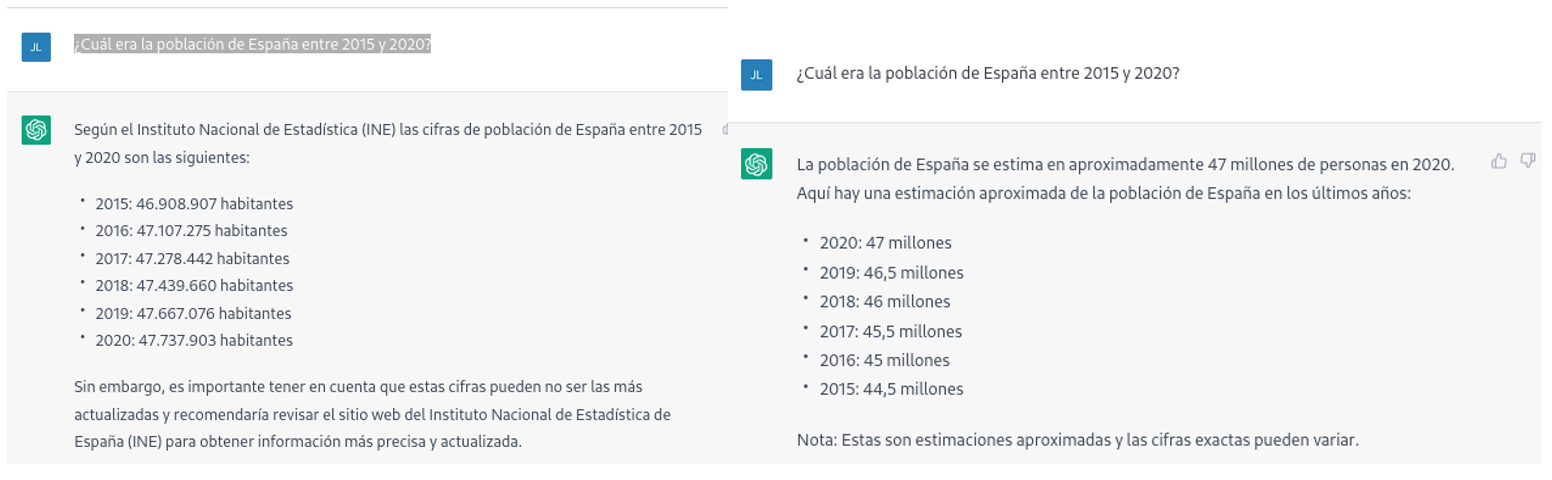
As we can see in the image above, although the question is the same, the answer may vary in both the wording and the information it contains. The variations can be even greater if we ask the question on different days or in different threads: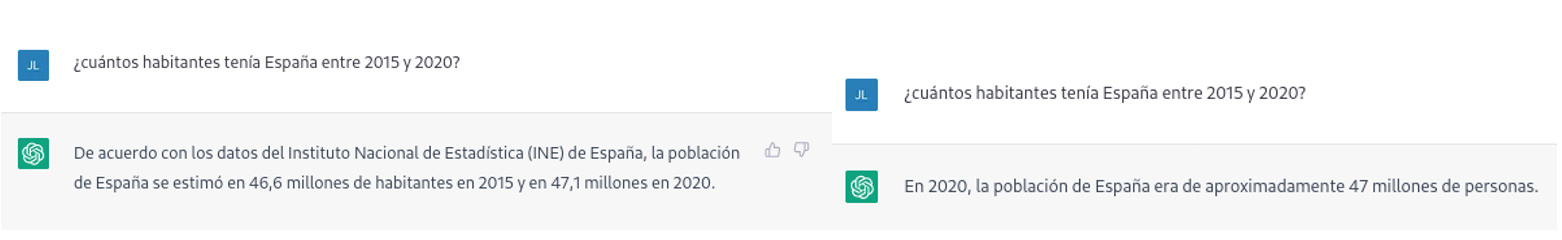
Small variations in the wording of the text, generating the question at different times in the conversation thread (remember that it saves the context) or in different threads or on different days may lead to slightly different results. Moreover, the answer is not completely accurate, as the tool itself warns us if we compare it with the INE's own series on the resident population in Spain, where it recommends us to consult. The data that we would ideally have expected in the response could be obtained in an open INE dataset:
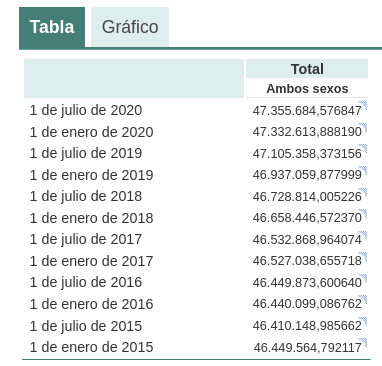
Such responses suggest that open data has not been used as an authoritative source for answering factual questions, or at least that the model is not yet fully refined on this matter. Doing some basic tests with questions about other countries we have observed similar errors, so this does not seem to be a problem only with questions referring to Spain.
If we ask more specific questions, such as asking for a list of the municipalities in the province of Burgos that begin with the letter "G", we get answers that are not completely correct, as is typical of a technology that is still in its infancy.
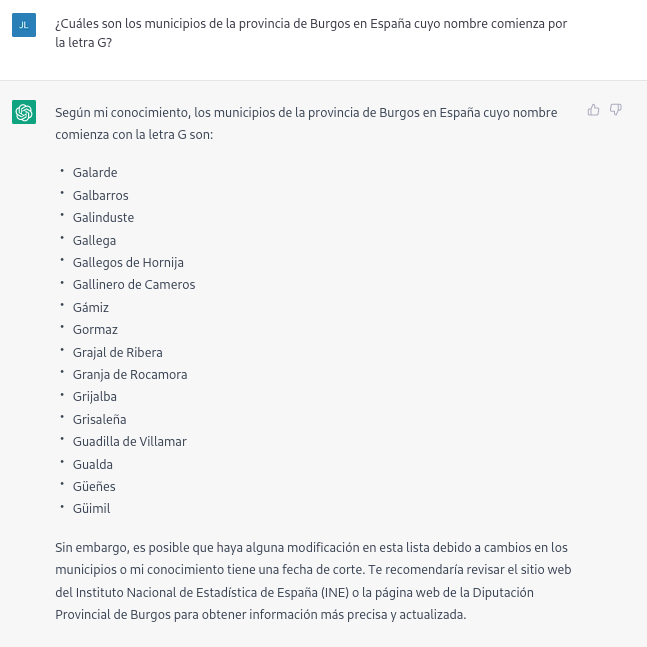
The correct answer should contain six municipalities: Galbarros, La Gallega, Grijalba, Grisaleña, Gumiel de Hizán and Gumiel del Mercado. However, the answer we have obtained only contains the first four and includes localities in the province of Guadalajara (Gualda), municipalities in the province of Valladolid (Gallegos de Hornija) or localities in the province of Burgos that are not municipalities (Galarde). In this case, we can also turn to the open dataset to get the correct answer.
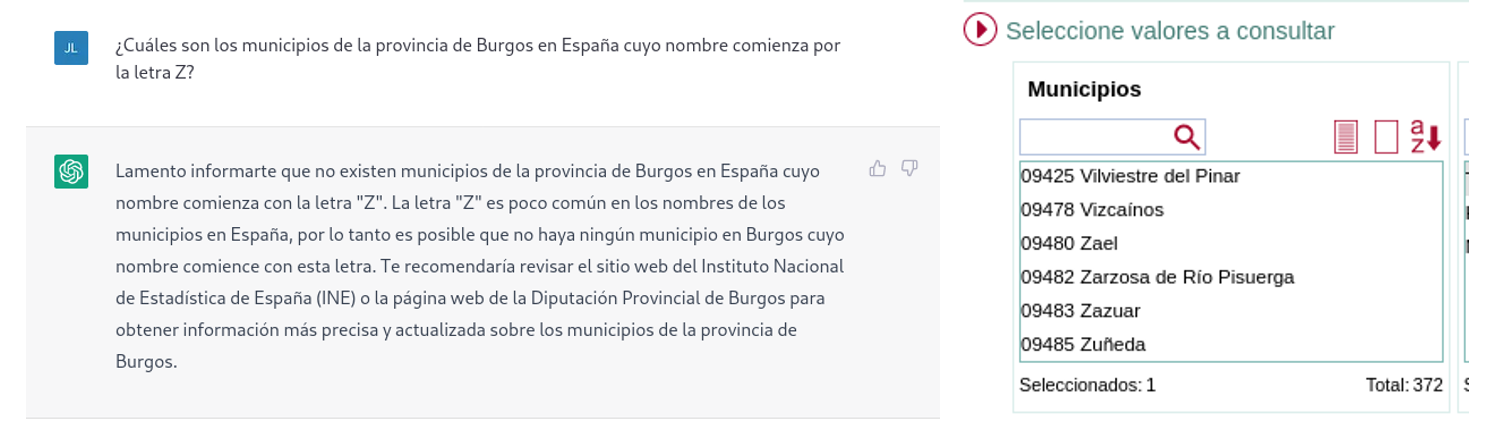
Next, we ask ChatGPT for the list of municipalities beginning with the letter Z in the same province. ChatGPT tells us that there are none, reasoning the answer, when in fact there are four:
As can be seen from the examples above, we can see how open data can indeed contribute to technological evolution and thus improve the performance of Open AI's artificial intelligence. However, given its current state of maturity, it is still too early to see the optimal use of open data to answer more complex questions.
Therefore, for a generative AI model to be effective, it is necessary to have a large amount of high quality and diverse data, and open data is a valuable source of knowledge for this purpose.
In future versions of the model, we will probably be able to see how open data will acquire a much more important role in the composition of the training corpus, achieving a significant improvement in the quality of the factual answers.
Content prepared by Jose Luis Marín, Senior Consultant in Data, Strategy, Innovation & Digitalization.
The contents and views reflected in this publication are the sole responsibility of the author.
Blog
For years now we have been announcing that Artificial Intelligence is undergoing one of its most prolific, exciting periods. A time when applications and use cases begin to be seen in which human intelligence merges with artificial intelligence. Some occupations are changing forever. Journalists and writers now have software tools that can write for them. Content creators - images or video - can ask the machine to create for them just by saying a phrase. In this post we have taken a closer look at this last example. We have been able to test Dall-e 2 and the results have left us speechless.
Introduction
Nowadays, in the technological community worldwide, there is an underlying buzz, a collective excitement of all lovers of digital technologies and in particular of artificial intelligence. On several occasions we have mentioned the innovations of the company Open AI in this communication space. We have written several articles where we talk about the GPT-3 algorithm and what it is capable of in the field of natural language processing. Recently, OpenAI has been doing away with the waiting lists (on which many of us had been enrolled for a long time) to allow us to test in a limited way the capabilities of the GPT-3 algorithm implemented in different types of applications.
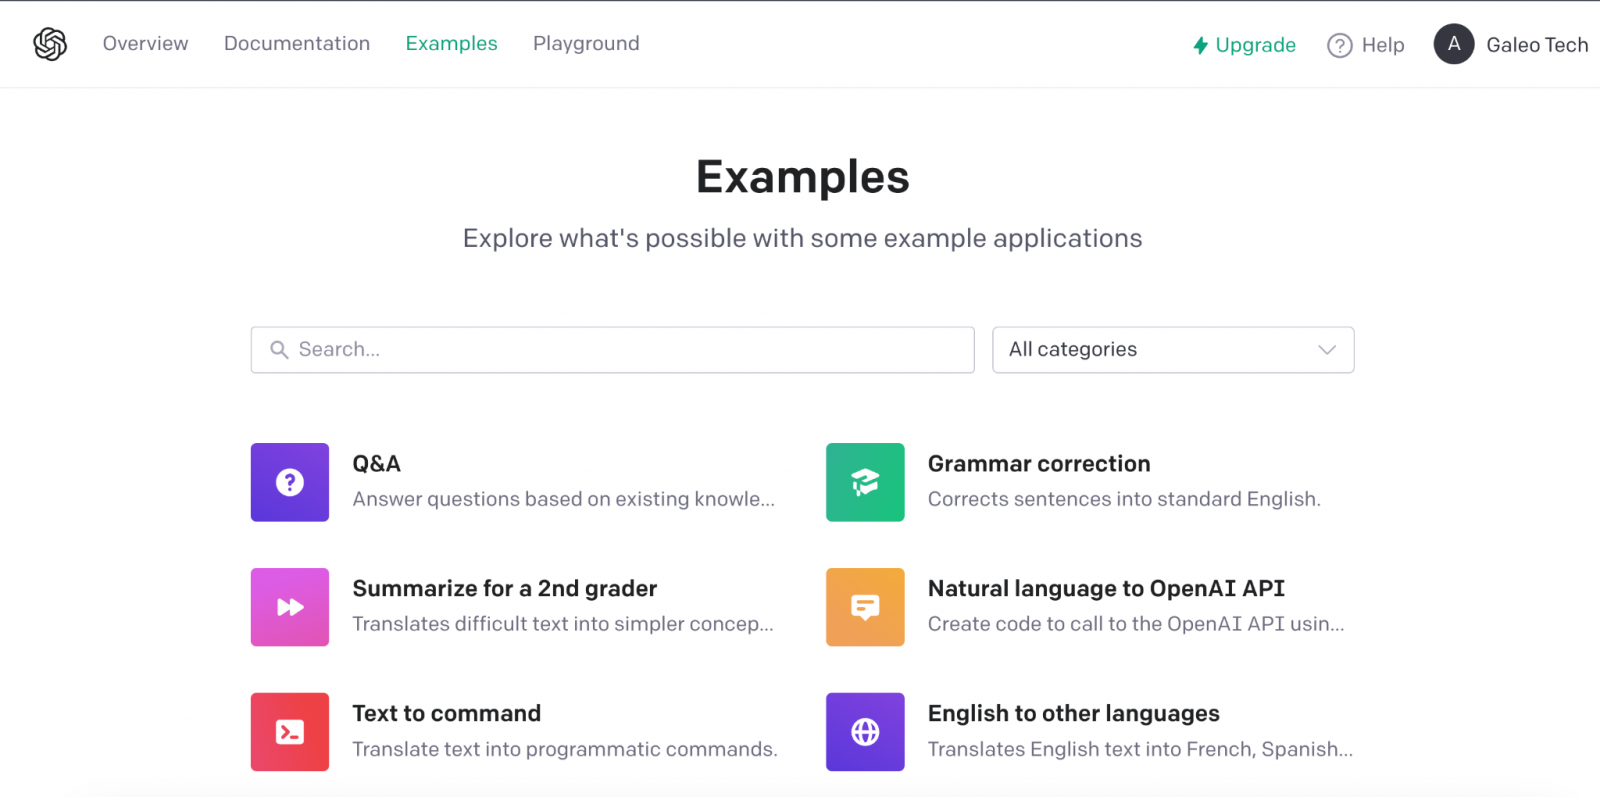
Example of the multiple applications of GPT-3 in the field of natural language.
We recommend our readers to try out the text completion tool with which, merely by providing a short sentence, the AI completes the text with several paragraphs indistinguishable from human writing. The last few days have been hectic with crowds of people testing the ChatGPT-3 tool. The degree of naturalness with which AI can have a conversation is simply amazing. The results are having an impact on a wide variety of use cases, such as support for software developers. ChatGPT-3 has been able to programme simple code routines or algorithms just from a description in natural language of what you want to programme. However, the result is even more impressive when we realise that AI is capable of correcting its own programming errors.
DALL-E
Leaving aside the capabilities of generating natural language indistinguishable from that written by a human, now let's take a look the main theme of this post. One of the most amazing applications of the AI of OpenAI is the solution known as DALL-E. What better way to introduce DALL-E than ask ChatGPT-3 what DALL-E is.
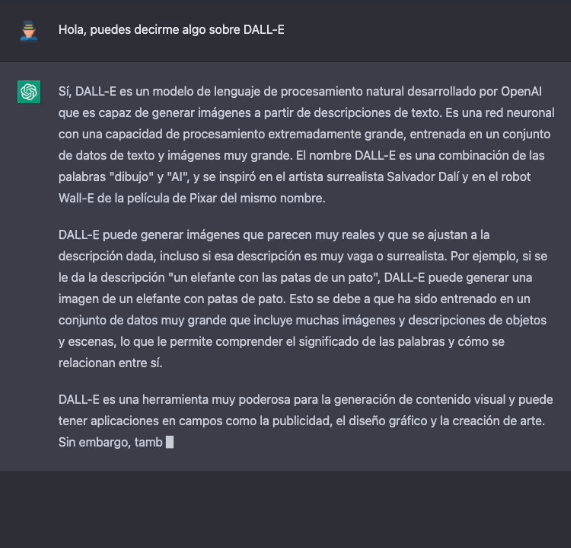
The more formal description of DALL-E, according to its own website, is as follows:
DALL·E is a 12-billion parameter version of GPT-3 trained to generate images from text descriptions. DALL-E has a diverse set of capabilities, including creating anthropomorphised versions of animals and objects, combining unrelated concepts in plausible ways, rendering text, and applying transformations to existing images..
There is currently a second version of the algorithm. DALL-E 2 capable of generating more realistic and precise images with a resolution 4 times higher. The tool for trying out DALL-E is available here https://labs.openai.com/. To use it, we first need to create an OpenAI account that will allow us to play with all the tools of the company. When we access the test website we can write our own text or ask the tool to generate random descriptions of images in natural language to create images. For example, by clicking the Surprise me button:
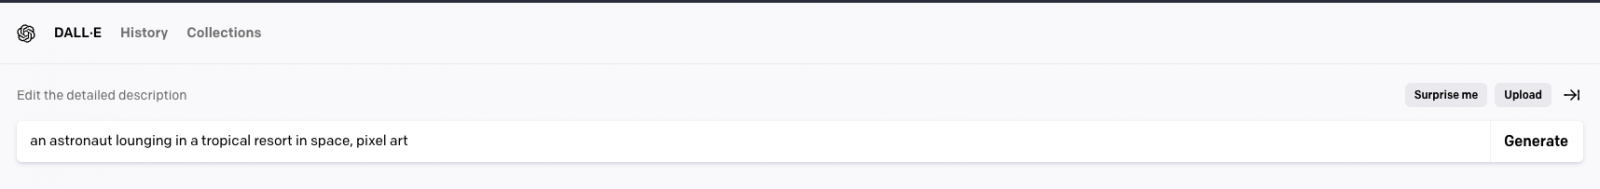
The web generates this random description for us: an astronaut lounging in a tropical resort in space, pixel art
And this is the result:

We repeat: An expressive oil painting of a basketball player dunking, depicted as an explosion of a nebula
We can assure you that the exercise is somewhat addictive and we admit that some of us have spent hours of our weekends playing with the descriptions and waiting, over and over again, for the amazing result.
About DALL-E 2 training
DALL-E 2 (arXiv:2204.06125) is a refined version of the original DALL-E system (arXiv:2102.12092). To train the original DALL-E model, which contains 12 billion parameters, a set of 250 million text-image pairs was used (publicly available online). This data set is a mixture of several prior datasets comprising: Conceptual Captions by Google; Wikipedia's text-image pairs and a filtered subset of YFCC100M.
DALL-E 2 trivia
Some interesting things besides the tests that we can do to generate our own images. OpenAI has created a specific Github repository which describes the risks and limitations of DALL-E. At the site it is reported, for example, that, for the time being, the use of DALL-E is limited to non-commercial purposes. So it is not possible to make any commercial use of the images generated. In other words, they cannot be sold or licensed under any circumstances. In this regard, all the images generated by DALL-E include a distinctive mark that lets you know that they have been generated by AI. At the Github site we can find loads of information about the generation of explicit content, the risks related with the bias that AI can introduce into the generation of images and the inappropriate uses of DALL-E such as the harassment, bullying or exploitation of individuals.

Along national lines, MarIA
Along national lines, after months of tests and adjustments, MarIA, the first supermassive artificial intelligence, has seen the light of day, trained with open data from the web archives of the National Library of Spain (BNE) and thanks to the computing resources of the National Supercomputing Centre. With regard to this post, MarIA has been trained using the GPT-2 algorithm which we have talked about many months ago in this space. To carry out the MarIA training, 135 billion previous words from the National Library's documentary bank have been used with a total volume of 570 Gigabytes of information.
Conclusions
As the days and weeks go by since the general opening of the APIs and the OpenIA tools, there has been a torrent of publications on all kinds of media, social media and specialised blogs about the capabilities and possibilities of Chat GPT-3 and DALL-E. I don't think that at this time anyone is capable of predicting the potential commercial, scientific and social applications of this technology. What is clear is that many of us think that OpenAI has shown only a sample of what it is capable of and it seems that we may be on the verge of a historic milestone in the development of AI after many years of overexpectations and unfulfilled promises. We will continue to report on the progress of GTP-3, but for the time being, all we can do is to keep enjoying, playing and learning with the simple tools that we have at our disposal!
Content prepared by Alejandro Alija, an expert in Digital Transformation.
The contents and points of view reflected in this publication are the sole responsibility of its author.
Blog
It has been a long time since that famous article entitled “Data Scientist: The Sexiest Job of the 21st Century” was published in 2012. Since then, the field of data science has become highly professionalised. A multitude of techniques, frameworks and tools have been developed that accelerate the process of turning raw data into valuable information. One of these techniques is known as Auto ML or Automatic Machine Learning. In this article we will review the advantages and characteristics of this method.
In a data science process, any data scientist usually uses a systematic working method, whereby raw data is distilled until information of value to the business from which the data is derived is extracted. There are several definitions of the data analysis process, although they are all very similar with minor variations. The following figure shows an example of a data analysis process or workflow.

As we can see, we can distinguish three stages:
- Importing and cleaning.
- Scanning and modelling.
- Communication.
Depending on the type of source data and the result we seek to achieve with this data, the modelling process may vary. However, regardless of the model, the data scientist must be able to obtain a clean dataset ready to serve as input to the model. In this post we will focus on the second stage: exploration and modelling.
Once this clean and error-free data has been obtained (after import and cleaning in step 1), the data scientist must decide which transformations to apply to the data, with the aim of making some data derived from the originals (in conjunction with the originals), the best indicators of the model underlying the dataset. We call these transformations features.
The next step is to divide our dataset into two parts: one part, for example 60% of the total dataset, will serve as the training dataset. The remaining 40% will be reserved for applying our model, once it has been trained. We call this second part the test subset. This process of splitting the source data is done with the intention of assessing the reliability of the model before applying it to new data unknown to the model. An iterative process now unfolds in which the data scientist tests various types of models that he/she believes may work on this dataset. Each time he/she applies a model, he/she observes and measures the mathematical parameters (such as accuracy and reproducibility) that express how well the model is able to reproduce the test data. In addition to testing different types of models, the data scientist may vary the training dataset with new transformations, calculating new and different features, in order to come up with some features that make the model in question fit the data better.
We can imagine that this process, repeated dozens or hundreds of times, is a major consumer of both human and computational resources. The data scientist tries to perform different combinations of algorithms, models, features and percentages of data, based on his or her experience and skill with the tools. However, what if it were a system that would perform all these combinations for us and finally come up with the best combination? Auto ML systems have been created precisely to answer this question.
In my opinion, an Auto ML system or tool is not intended to replace the data scientist, but to complement him or her, helping the data scientist to save a lot of time in the iterative process of trying different techniques and data to reach the best model. Generally speaking, we could say that an Auto ML system has (or should have) the following benefits for the data scientist:
- Suggest the best Machine Learning techniques and automatically generate optimised models (automatically adjusting parameters), having tested a large number of training and test datasets respectively.
- Inform the data scientist of those features (remembering that they are transformations of the original data) that have the greatest impact on the final result of the model.
- Generate visualisations that allow the data scientist to understand the outcome of the process carried out by Auto ML. That is, to teach the Auto ML user the key indicators of the outcome of the process.
- Generate an interactive simulation environment that allows users to quickly explore the model to see how it works.
Finally, we mention some of the best-known Auto ML systems and tools, such as H2O.ai, Auto-Sklearn end TPOT. It should be noted that these three systems cover the entire Machine Learning process that we saw at the beginning. However, there are more solutions and tools that partially cover some of the steps of the complete process. There are also articles comparing the effectiveness of these systems for certain machine learning problems on open and accessible datasets.
In conclusion, these tools provide valuable solutions to common data science problems and have the potential to dramatically improve the productivity of data science teams. However, data science still has a significant art component and not all problems are solved with automation tools. We encourage all algorithm alchemists and data craftsmen to continue to devote time and effort to developing new techniques and algorithms that allow us to turn data into value quickly and effectively.
The aim of this post is to explain to the general public, in a simple and accessible way, how auto ML techniques can simplify the process of advanced data analysis. Sometimes oversimplifications may be used in order not to overcomplicate the content of this post.
Content elaborated by Alejandro Alija, expert in Digital Transformation and Innovation.
Contents and points of view expressed in this publication are the exclusive responsibility of its author.
Blog
A few weeks ago, we told you about the different types of machine learning through a series of examples, and we analysed how to choose one or the other based on our objectives and the datasets available to train the algorithm.
Now let's assume that we have an already labelled dataset and we need to train a supervised learning model to solve the task at hand. At this point, we need some mechanism to tell us whether the model has learned correctly or not. That is what we are going to discuss in this post, the most used metrics to evaluate the quality of our models.
Model evaluation is a very important step in the development methodology of machine learning systems. It helps to measure the performance of the model, that is, to quantify the quality of the predictions it offers. To do this, we use evaluation metrics, which depend on the learning task we apply. As we saw in the previous post, within supervised learning there are two types of tasks that differ, mainly, in the type of output they offer:
- Classification tasks, which produce as output a discrete label, i.e. when the output is one within a finite set.
- Regression tasks, which output a continuous real value.
Here are some of the most commonly used metrics to assess the performance of both types of tasks:
Evaluation of classification models
In order to better understand these metrics, we will use as an example the predictions of a classification model to detect COVID patients. In the following table we can see in the first column the example identifier, in the second column the class predicted by the model, in the third column the actual class and the fourth column indicates whether the model has failed in its prediction or not. In this case, the positive class is "Yes" and the negative class is "No".

Examples of evaluation metrics for classification model include the following:
- Confusion matrix: this is a widely used tool that allows us to visually inspect and evaluate the predictions of our model. Each row represents the number of predictions of each class and the columns represent the instances of the actual class.
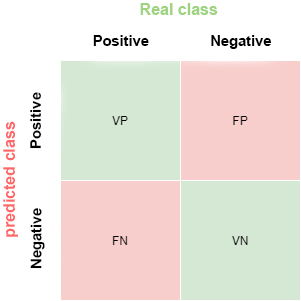
The description of each element of the matrix is as follows:
True Positive (VP): number of positive examples that the model predicts as positive. In the example above, VP is 1 (from example 6).
False positive (FP): number of negative examples that the model predicts as positive. In our example, FP is equal to 1 (from example 4).
False negative (FN): number of positive examples that the model predicts as negative. FN in the example would be 0.
True negative (VN): number of negative examples that the model predicts as negative. In the example, VN is 8.
- Accuracy: the fraction of predictions that the model made correctly. It is represented as a percentage or a value between 0 and 1. It is a good metric when we have a balanced dataset, that is, when the number of labels of each class is similar. The accuracy of our example model is 0.9, since it got 9 predictions out of 10 correct. If our model had always predicted the "No" label, the accuracy would be 0.9 as well, but it does not solve our problem of identifying COVID patients.
- Recall: indicates the proportion of positive examples that are correctly identified by the model out of all actual positives. That is, VP / (VP + FN). In our example, the sensitivity value would be 1 / (1 + 0) = 1. If we were to evaluate with this metric, a model that always predicts the positive label ("Yes") would have a sensitivity of 1, but it would not be a very intelligent model. Although the ideal for our COVID detection model is to maximise sensitivity, this metric alone does not ensure that we have a good model.
- Precision: this metric is determined by the fraction of items correctly classified as positive among all items that the model has classified as positive. The formula is VP / (VP + FP). The example model would have an accuracy of 1 / (1 + 1) = 0.5. Let us now return to the model that always predicts the positive label. In that case, the accuracy of the model is 1 / (1 + 9) = 0.1. We see how this model had a maximum sensitivity, but has a very poor accuracy. In this case we need both metrics to evaluate the real quality of the model.
- F1 score: combines the Precision and Recall metrics to give a single score. This metric is the most appropriate when we have unbalanced datasets. It is calculated as the harmonic mean of Precision and Recall. The formula is F1 = (2 * precision * recall) / (precision + recall). You may wonder why we use the harmonic mean and not the simple mean. This is because the harmonic mean means that if one of the two measurements is small (even if the other is maximum), the value of F1 score is going to be small.
Evaluation of regression models
Unlike classification models, in regression models it is almost impossible to predict the exact value, but rather to be as close as possible to the real value, so most metrics, with subtle differences between them, are going to focus on measuring that: how close (or far) the predictions are from the real values.
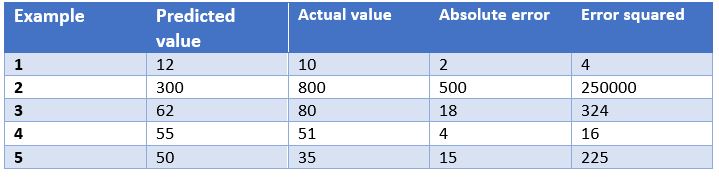
In this case, we have as an example the predictions of a model that determines the price of watches depending on their characteristics. In the table we show the price predicted by the model, the actual price, the absolute error and the squared error.
Some of the most common evaluation metrics for regression models are:
- Mean Absolute Error: This is the mean of the absolute differences between the target and predicted values. Since it is not squared, it does not penalise large errors, which makes it not very sensitive to outliers, so it is not a recommended metric in models where attention must be paid to outliers. This metric also represents the error on the same scale as the actual values. Ideally, its value should be close to zero. For our watch pricing model, the mean absolute error is 107.8.
- Mean Squared Errors: One of the most commonly used measures in regression work. It is simply the mean of the differences between the target and the predicted value squared. By squaring the errors, it magnifies large errors, so use it with care when we have outliers in our data set. It can take values between 0 and infinity. The closer the metric is to zero, the better. The mean square error of the example model is 50113.8. We see how in the case of our example large errors are magnified.
- Root Mean Squared Srror: This is equal to the square root of the previous metric. The advantage of this metric is that it presents the error in the same units as the target variable, which makes it easier to understand. For our model this error is equal to 223.86.
- R-squared: also called the coefficient of determination. This metric differs from the previous ones, as it compares our model with a basic model that always returns as prediction the mean of the training target values. The comparison between these two models is made on the basis of the mean squared errors of each model. The values this metric can take range from minus infinity to 1. The closer the value of this metric is to 1, the better our model is. The R-squared value for the model will be 0.455.
- Adjusted R-squared. An improvement of R-squared. The problem with the previous metric is that every time more independent variables (or predictor variables) are added to the model, R-squared stays the same or improves, but never gets worse, which can be confusing, because just because one model uses more predictor variables than another, it does not mean that it is better. Adjusted R-squared compensates for the addition of independent variables. The adjusted R-squared value will always be less than or equal to the R-squared value, but this metric will show improvement when the model is actually better. For this measure we cannot do the calculation for our example model because, as we have seen before, it depends on the number of examples and the number of variables used to train such a model.
Conclusion
When working with supervised learning algorithms it is very important to choose a correct evaluation metric for our model. For classification models it is very important to pay attention to the dataset and check whether it is balanced or not. For regression models we have to consider outliers and whether we want to penalise large errors or not.
Generally, however, the business domain will guide us in the right choice of metric. For a disease detection model, such as the one we have seen, we are interested in high sensitivity, but we are also interested in a good accuracy value, so F1-score would be a smart choice. On the other hand, in a model to predict the demand for a product (and therefore production), where overstocking may incur a storage cost overrun, it may be a good idea to use the mean squared errors to penalise large errors.
Content elaborated by Jose Antonio Sanchez, expert in Data Science and enthusiast of the Artificial Intelligence.
Contents and points of view expressed in this publication are the exclusive responsibility of its author.
Blog
Can you imagine an AI capable of writing songs, novels, press releases, interviews, essays, technical manuals, programming code, prescribing medication and much more that we don't know yet? Watching GPT-3 in action doesn't seem like we're very far away.
In our latest report on natural language processing (NLP) we mentioned the GPT-2 algorithm developed by OpenAI (the company founded by such well-known names as Elon Musk) as an exponent of its capabilities for generating synthetic text with a quality indistinguishable from any other human-created text. The surprising results of GPT-2 led the company not to publish the source code of the algorithm because of its potential negative effects on the generation of deepfakes or false news
Recently (May 2020) a new version of the algorithm has been released, now called GPT-3, which includes functional innovations and improvements in performance and capacity to analyse and generate natural language texts.
In this post we try to summarize in a simple and affordable way the main new features of GPT-3. Do you dare to discover them?
We start directly, getting to the point. What does GPT-3 bring with it? (adaptation of the original post by Mayor Mundada).
- It is much bigger (complex) than everything we had before. Deep learning models based on neural networks are usually classified by their number of parameters. The greater the number of parameters, the greater the depth of the network and therefore its complexity. The training of the full version of GPT-2 resulted in 1.5 billion parameters. GPT-3 results in 175 billion parameters. GPT-3 has been trained on a basis of 570 GB of text compared to 40 GB of GPT-2.
- For the first time, it can be used as a product or service. For the first time it can be used as a product or service. That is, OpenAI has announced the availability of a public API for users to experiment with the algorithm. At the time of writing this post, access to the API is restricted (this is what we call a private preview) and access must be requested.
- The most important thing: the results. Despite the fact that the API is restricted by invitation, many Internet users (with access to the API) have published articles on its results in different fields.
What role do open data play?
It is rarely possible to see the power and benefits of open data as in this type of project. As mentioned above GPT-3 has been trained with 570 GB of data in text format. Well, it turns out that 60% of the training data of the algorithm comes from the source https://commoncrawl.org. Common Crawl is an open and collaborative project that provides a corpus for research, analysis, education, etc. As specified on the Common Crawl website the data provided are open and hosted under the AWS open data initiative. Much of the rest of the training data is also open including sources such as Wikipedia.
Use cases
Below are some of the examples and use cases that have had an impact.
Generation of synthetic text
This entry (no spoilers ;) ) from Manuel Araoz's blog shows the power of the algorithm to generate a 100% synthetic article on Artificial Intelligence. Manuel performs the following experiment: he provides GPT-3 with a minimal description of his biography included in his blog and a small fragment of the last entry in his blog. 117 words in total. After 10 runs of GPT-3 to generate related artificial text, Manuel is able to copy and paste the generated text, place a cover image and has a new post ready for his blog. Honestly, the text of the synthetic post is indistinguishable from an original post except for possible errors in names, dates, etc. that the text may include.
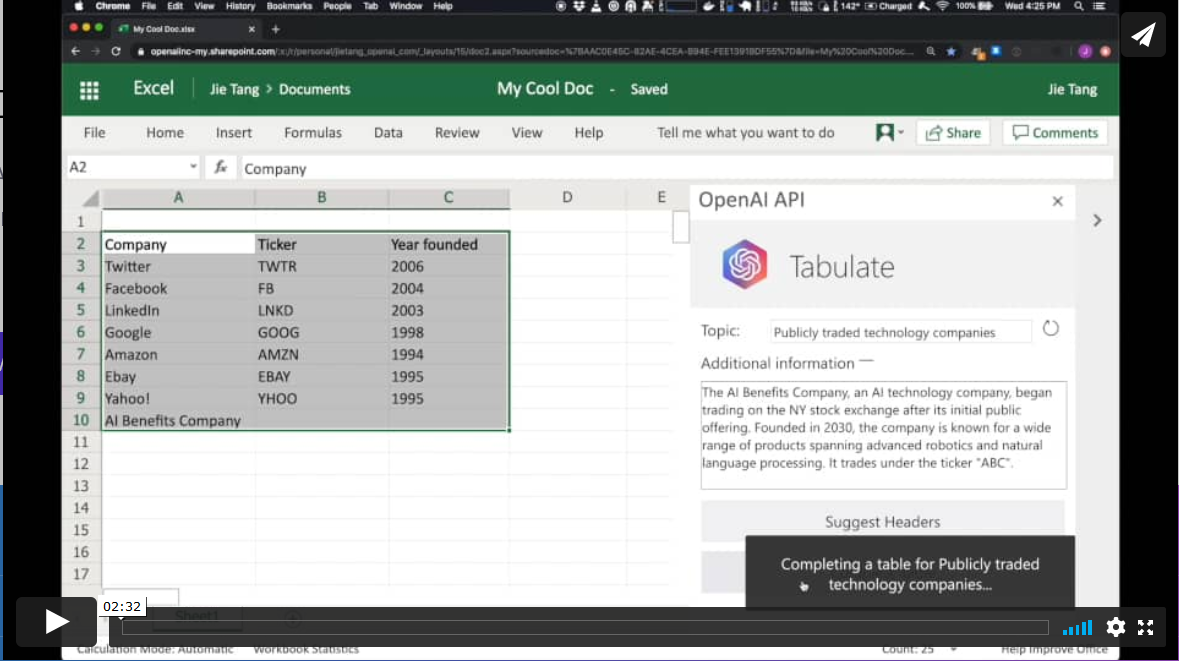
Productivity. Automatic generation of data tables.
In a different field, the GPT-3 algorithm has applications in the field of productivity. In this example GPT-3 is able to create a MS Excel table on a certain topic. For example, if we want to obtain a table, as a list, with the most representative technology companies and their year of foundation, we simply provide GPT-3 with the desired pattern and ask it to complete it. The starting pattern can be something similar to this table below (in a real example, the input data will be in English). GPT-3 will complete the shaded area with actual data. However, if in addition to the input pattern, we provide the algorithm with a plausible description of a fictitious technology company and ask you again to complete the table with the new information, the algorithm will include the data from this new fictitious company.
These examples are just a sample of what GPT-3 is capable of doing. Among its functionalities or applications are:
- semantic search (different from keyword search)
- the chatbots
- the revolution in customer services (call-center)
- the generation of multi-purpose text (creation of poems, novels, music, false news, opinion articles, etc.)
- productivity tools. We have seen an example on how to create data tables, but there is talk (and much) about the possibility of creating simple software such as web pages and small simple applications without the need for coding, just by asking GPT-3 and its brothers who are coming.
- online translation tools
- understanding and summarizing texts.
and so many other things we haven't discovered yet... We will continue to inform you about the next developments in NLP and in particular about GPT-3, a game-changer that has come to revolutionize everything we know at the moment.
Content elaborated by Alejandro Alija, expert in Digital Transformation and Innovation.
Contents and points of view expressed in this publication are the exclusive responsibility of its author.