Documentación
1. Introduction
Data visualization is a task linked to data analysis that aims to graphically represent underlying data information. Visualizations play a fundamental role in the communication function that data possess, since they allow to drawn conclusions in a visual and understandable way, allowing also to detect patterns, trends, anomalous data or to project predictions, alongside with other functions. This makes its application transversal to any process in which data intervenes. The visualization possibilities are very numerous, from basic representations, such as a line graphs, graph bars or sectors, to complex visualizations configured from interactive dashboards.
Before we start to build an effective visualization, we must carry out a pre-treatment of the data, paying attention to how to obtain them and validating the content, ensuring that they do not contain errors and are in an adequate and consistent format for processing. Pre-processing of data is essential to start any data analysis task that results in effective visualizations.
A series of practical data visualization exercises based on open data available on the datos.gob.es portal or other similar catalogues will be presented periodically. They will address and describe, in a simple way; the stages necessary to obtain the data, perform the transformations and analysis that are relevant for the creation of interactive visualizations, from which we will be able summarize on in its final conclusions the maximum mount of information. In each of the exercises, simple code developments will be used (that will be adequately documented) as well as free and open use tools. All generated material will be available for reuse in the Data Lab repository on Github.
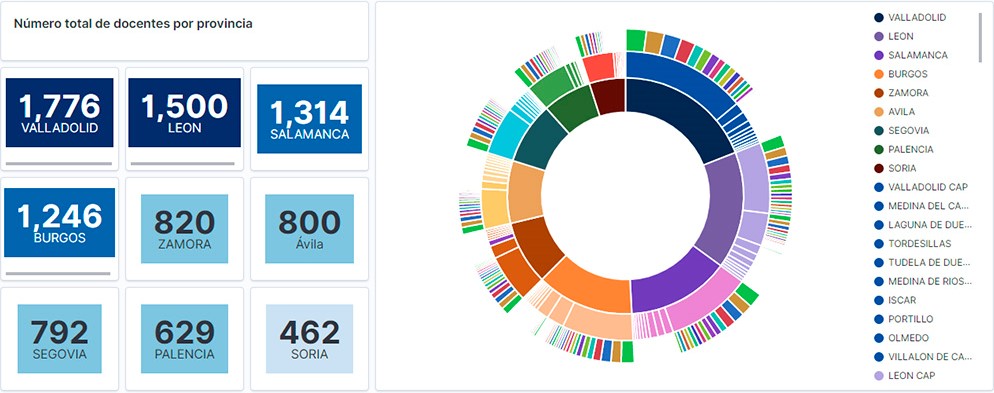
Visualization of the teaching staff of Castilla y León classified by Province, Locality and Teaching Specialty
2. Objetives
The main objective of this post is to learn how to treat a dataset from its download to the creation of one or more interactive graphs. For this, datasets containing relevant information on teachers and students enrolled in public schools in Castilla y León during the 2019-2020 academic year have been used. Based on these data, analyses of several indicators that relate teachers, specialties and students enrolled in the centers of each province or locality of the autonomous community.
3. Resources
3.1. Datasets
For this study, datasets on Education published by the Junta de Castilla y León have been selected, available on the open data portal datos.gob.es. Specifically:
- Dataset of the legal figures of the public centers of Castilla y León of all the teaching positions, except for the schoolteachers, during the academic year 2019-2020. This dataset is disaggregated by specialty of the teacher, educational center, town and province.
- Dataset of student enrolments in schools during the 2019-2020 academic year. This dataset is obtained through a query that supports different configuration parameters. Instructions for doing this are available at the dataset download point. The dataset is disaggregated by educational center, town and province.
3.2. Tools
To carry out this analysis (work environment set up, programming and writing) Python (versión 3.7) programming language and JupyterLab (versión 2.2) have been used. This tools will be found integrated in Anaconda, one of the most popular platforms to install, update or manage software to work with Data Science. All these tools are open and available for free.
JupyterLab is a web-based user interface that provides an interactive development environment where the user can work with so-called Jupyter notebooks on which you can easily integrate and share text, source code and data.
To create the interactive visualization, the Kibana tool (versión 7.10) has been used.
Kibana is an open source application that is part of the Elastic Stack product suite (Elasticsearch, Logstash, Beats and Kibana) that provides visualization and exploration capabilities of indexed data on top of the Elasticsearch analytics engine..
If you want to know more about these tools or others that can help you in the treatment and visualization of data, you can see the recently updated \"Data Processing and Visualization Tools\" report.
4. Data processing
As a first step of the process, it is necessary to perform an exploratory data analysis (EDA) to properly interpret the starting data, detect anomalies, missing data or errors that could affect the quality of subsequent processes and results. Pre-processing of data is essential to ensure that analyses or visualizations subsequently created from it are consistent and reliable.
Due to the informative nature of this post and to favor the understanding of non-specialized readers, the code does not intend to be the most efficient, but to facilitate its understanding. So you will probably come up with many ways to optimize the proposed code to get similar results. We encourage you to do so! You will be able to reproduce this analysis since the source code is available in our Github account. The way to provide the code is through a document made on JupyterLab that once loaded into the development environment you can execute or modify easily.
4.1. Installation and loading of libraries
The first thing we must do is import the libraries for the pre-processing of the data. There are many libraries available in Python but one of the most popular and suitable for working with these datasets is Pandas. The Pandas library is a very popular library for manipulating and analyzing datasets.
import pandas as pd 4.2. Loading datasets
First, we download the datasets from the open data catalog datos.gob.es and upload them into our development environment as tables to explore them and perform some basic data cleaning and processing tasks. For the loading of the data we will resort to the function read_csv(), where we will indicate the download url of the dataset, the delimiter (\"\";\"\" in this case) and, we add the parameter \"encoding\"\" that we adjust to the value \"\"latin-1\"\", so that it correctly interprets the special characters such as the letters with accents or \"\"ñ\"\" present in the text strings of the dataset.
#Cargamos el dataset de las plantillas jurídicas de los centros públicos de Castilla y León de todos los cuerpos de profesorado, a excepción de los maestros url = \"https://datosabiertos.jcyl.es/web/jcyl/risp/es/educacion/plantillas-centros-educativos/1284922684978.csv\"docentes = pd.read_csv(url, delimiter=\";\", header=0, encoding=\"latin-1\")docentes.head(3)#Cargamos el dataset de los alumnos matriculados en los centros educativos públicos de Castilla y León alumnos = pd.read_csv(\"matriculaciones.csv\", delimiter=\",\", names=[\"Municipio\", \"Matriculaciones\"], encoding=\"latin-1\") alumnos.head(3)The column \"\"Localidad\"\" of the table \"\"alumnos\"\" is composed of the code of the municipality and the name of the same. We must divide this column in two, so that its treatment is more efficient.
columnas_Municipios = alumnos[\"Municipio\"].str.split(\" \", n=1, expand = TRUE)alumnos[\"Codigo_Municipio\"] = columnas_Municipios[0]alumnos[\"Nombre_Munipicio\"] = columnas_Munipicio[1]alumnos.head(3)4.3. Creating a new table
Once we have both tables with the variables of interest, we create a new table resulting from their union. The union variables will be: \"\"Localidad\"\" in the table of \"\"docentes\"\" and \"\"Nombre_Municipio” in the table of \"\"alumnos\".
docentes_alumnos = pd.merge(docentes, alumnos, left_on = \"Localidad\", right_on = \"Nombre_Municipio\")docentes_alumnos.head(3)4.4. Exploring the dataset
Once we have the table that interests us, we must spend some time exploring the data and interpreting each variable. In these cases, it is very useful to have the data dictionary that always accompanies each downloaded dataset to know all its details, but this time we do not have this essential tool. Observing the table, in addition to interpreting the variables that make it up (data types, units, ranges of values), we can detect possible errors such as mistyped variables or the presence of missing values (NAs) that can reduce analysis capacity.
docentes_alumnos.info()In the output of this section of code, we can see the main characteristics of the table:
- Contains a total of 4,512 records
- It is composed of 13 variables, 5 numerical variables (integer type) and 8 categorical variables (\"object\" type)
- There is no missing of values.
Once we know the structure and content of the table, we must rectify errors, as is the case of the transformation of some of the variables that are not properly typified, for example, the variable that houses the center code (\"Código.centro\").
docentes_alumnos.Codigo_centro = data.Codigo_centro.astype(\"object\")docentes_alumnos.Codigo_cuerpo = data.Codigo_cuerpo.astype(\"object\")docentes_alumnos.Codigo_especialidad = data.Codigo_especialidad.astype(\"object\")Once we have the table free of errors, we obtain a description of the numerical variables, \"\"Plantilla\" and \"\"Matriculaciones\", which will help us to know important details. In the output of the code that we present below we observe the mean, the standard deviation, the maximum and minimum number, among other statistical descriptors.
docentes_alumnos.describe()4.5. Save the dataset
Once we have the table free of errors and with the variables that we are interested in graphing, we will save it in a folder of our choice to use it later in other analysis or visualization tools. We will save it in CSV format encoded as UTF-8 (Unicode Transformation Format) so that special characters are correctly identified by any tool we might use later.
df = pd.DataFrame(docentes_alumnos)filname = \"docentes_alumnos.csv\"df.to_csv(filename, index = FALSE, encoding = \"utf-8\")5. Creation of the visualization on the teachers of the public educational centers of Castilla y León using the Kibana tool
For the realization of this visualization, we have used the Kibana tool in our local environment. To do this it is necessary to have Elasticsearch and Kibana installed and running. The company Elastic makes all the information about the download and installation available in this tutorial.
Attached below are two video tutorials, which shows the process of creating the visualization and the interaction with the generated dashboard.
In this first video, you can see the creation of the dashboard by generating different graphic representations, following these steps:
- We load the table of previously processed data into Elasticsearch and generate an index that allows us to interact with the data from Kibana. This index allows search and management of data, practically in real time.
- Generation of the following graphical representations:
- Graph of sectors where to show the teaching staff by province, locality and specialty.
- Metrics of the number of teachers by province.
- Bar chart, where we will show the number of registrations by province.
- Filter by province, locality and teaching specialty.
- Construction of the dashboard.
In this second video, you will be able to observe the interaction with the dashboard generated previously.
6. Conclusions
Observing the visualization of the data on the number of teachers in public schools in Castilla y León, in the academic year 2019-2020, the following conclusions can be obtained, among others:
- The province of Valladolid is the one with both the largest number of teachers and the largest number of students enrolled. While Soria is the province with the lowest number of teachers and the lowest number of students enrolled.
- As expected, the localities with the highest number of teachers are the provincial capitals.
- In all provinces, the specialty with the highest number of students is English, followed by Spanish Language and Literature and Mathematics.
- It is striking that the province of Zamora, although it has a low number of enrolled students, is in fifth position in the number of teachers.
This simple visualization has helped us to synthesize a large amount of information and to obtain a series of conclusions at a glance, and if necessary, make decisions based on the results obtained. We hope you have found this new post useful and we will return to show you new reuses of open data. See you soon!
Blog
In recent months there have been a number of important announcements related to the construction and exploitation of infrastructures and datasets related to health research. These initiatives aim to make data a vital part of a health system that is currently not extracting the maximum possible value from it.
The health data policy landscape, globally in general and in Europe in particular, is highly fragmented and regulatory inconsistency hampers innovation. While at least in Europe there are adequate safeguards to protect sensitive data, trust in the whole data ecosystem is still generally weak. As a result, willingness to share data at all levels is often low. But this situation seems to be changing at great speed, as the high number of initiatives we are seeing being born or developed in 2021 seems to demonstrate.
UK aims to position itself as a world leader
For example, mindful of the limitations we have described in the data ecosystem, the UK government has published in June 2021 the draft of its new strategy "Data saves lives: reshaping health and social care with data", which aims to capitalise on the work done during the pandemic to improve health and care services.
Although it is still in draft form - and has been criticised by privacy experts and patients' rights groups for not clarifying who will have access to the data - it makes no secret of the ambition to make the UK a world leader in health innovation through the use of data. The strategy aims to put people in control of their own data, while supporting the NHS in creating a modernised system fit for the 21st century that is able to open up and harness its vast data assets.
Another interesting initiative is the work being undertaken in 2021 by the Open Data Institute (ODI) as part of a wider research project commissioned by the pharmaceutical company Roche. ODI is mapping the use of health data standards across the European region in order to design a "Data governance playbook for data-driven healthcare projects", which can be used and shared globally.
July 2021 also saw the announcement of the commissioning of what has become the UK's most powerful supercomputer (and 41st in the world rankings), the Cambridge-1per. It will be dedicated to health sciences and to facilitating the resolution of problems related to medical care. With a $100 million investment from US company Nvidia, its creators hope it will help make the process of disease prevention, diagnosis and treatment better, faster and cheaper.

It is known, for example, that the pharmaceutical company GSK is already working with Nvidia to put its massive datasets to work to accelerate research into new drugs and vaccines. GSK will use Cambridge-1 to help discover new therapies faster by combining genetic and clinical data.
The use of data and artificial intelligence in healthcare is enjoying a period of huge growth in the UK that will undoubtedly be accelerated by these new initiatives. Some of these massive patient datasets such as the UK Biobank are not new, having been founded in 2012, but they are taking on renewed prominence in this context. The UK Biobank, available to researchers worldwide, includes anonymised medical and lifestyle records of half a million middle-aged UK patients and is regularly augmented with additional data.
The United States relies on private sector innovations
The United States has a strong innovation in open data from the private sector that is also evident when it comes to health data. For example, the well-known Data for Good project, which Facebook launched in 2017, has placed a strong emphasis on pandemic response in its activities. For example, by means of maps on population movement, they have contributed to a better understanding of the coronavirus crisis, always with an approach that aims to preserve people's privacy. In this type of project, where the input data is highly sensitive, the appropriate implementation of privacy-enhancing technologies for users is of great importance.
The European Union announces important steps
The European Union, on the other hand, is taking important steps, such as progress on the European Health Data Space, one of the Commission's priorities for the 2019-2025 period. We recall that the common European health data space will promote better exchange and access to different types of health data (electronic health records, genomic data, patient registry data, etc.), not only to support healthcare delivery but also for health research and policy making in the field of health.
The public consultation aimed at ensuring that all possible views are considered in the design of a new legal framework for a European health data space - and ensuring transparency and accountability - closed just a few weeks ago and the results, as well as the proposed EU legislation, are expected to be published in the last quarter. This new legislation is expected to provide a decisive impetus within the European Union for the publication of new health datasets.
For the time being, the proposal for a Regulation on European data governance (Data Governance Act) is available, which addresses such relevant and sensitive issues as the transfer of data from the public sector for re-use, the exchange of data between companies for remuneration or the transfer of data for altruistic purposes. Clarifying the regulatory framework for all these issues will undoubtedly contribute to fostering innovation in the field of health.
Spain also joins in boosting the use of health data
In Spain, although with some delay, important initiatives are also beginning to move, the fruits of which we will see in the coming years. Among the investments that the Spanish government will make thanks to the Recovery, Transformation and Resilience Plan, for example, the creation of a healthcare data lake has recently been announced with the aim of facilitating the development and implementation of massive data processing projects.
In some cases, regional health services, such as Andalusia, are already working on the implementation of innovative advanced analytics techniques for real use cases. Thus, in the project to implement a corporate advanced analytics solution, the Andalusian Health System plans to deploy, among others, recommendation engines to optimise waiting lists, computer vision techniques to assist in breast cancer screening or segmentation techniques for chronic patients.
One of the positive effects of the global pandemic caused by Covid-19 is that awareness of the need for an open and trusted data ecosystem that benefits the health of all has been amplified. The convergence of medical knowledge, technology and data science has the potential to revolutionise patient care, and the pandemic may provide a definitive boost to open health data. For the moment, as reported in the study "Analysis of the current state of health data openness at regional level through open data portals" and despite the remaining challenges, the progress made in health data openness, especially in the most advanced regions, is promising.
Content prepared by Jose Luis Marín, Senior Consultant in Data, Strategy, Innovation and Digitalization.
The contents and views expressed in this publication are the sole responsibility of the author.
Documentación
1. Introduction
Data visualization is a task linked to data analysis that aims to represent graphically the underlying information. Visualizations play a fundamental role in data communication, since they allow to draw conclusions in a visual and understandable way, also allowing detection of patterns, trends, anomalous data or projection of predictions, among many other functions. This makes its application transversal to any process that involves data. The visualization possibilities are very broad, from basic representations such as line, bar or sector graph, to complex visualizations configured on interactive dashboards.
Before starting to build an effective visualization, a prior data treatment must be performed, paying attention to their collection and validation of their content, ensuring that they are free of errors and in an adequate and consistent format for processing. The previous data treatment is essential to carry out any task related to data analysis and realization of effective visualizations.
We will periodically present a series of practical exercises on open data visualizations that are available on the portal datos.gob.es and in other similar catalogues. In there, we approach and describe in a simple way the necessary steps to obtain data, perform transformations and analysis that are relevant to creation of interactive visualizations from which we may extract all the possible information summarised in final conclusions. In each of these practical exercises we will use simple code developments which will be conveniently documented, relying on free tools. Created material will be available to reuse in Data Lab on Github.
Captura del vídeo que muestra la interacción con el dashboard de la caracterización de la demanda de empleo y la contratación registrada en España disponible al final de este artículo
2. Objetives
The main objective of this post is to create an interactive visualization using open data. For this purpose, we have used datasets containing relevant information on evolution of employment demand in Spain over the last years. Based on these data, we have determined a profile that represents employment demand in our country, specifically investigating how does gender gap affects a group and impact of variables such as age, unemployment benefits or region.
3. Resources
3.1. Datasets
For this analysis we have selected datasets published by the Public State Employment Service (SEPE), coordinated by the Ministry of Labour and Social Economy, which collects time series data with distinct breakdowns that facilitate the analysis of the qualities of job seekers. These data are available on datos.gob.es, with the following characteristics:
- Demandantes de empleo por municipio: contains the number of job seekers broken down by municipality, age and gender, between the years 2006-2020.
- Gasto de prestaciones por desempleo por Provincia: time series between the years 2010-2020 related to unemployment benefits expenditure, broken down by province and type of benefit.
- Contratos registrados por el Servicio Público de Empleo Estatal (SEPE) por municipio: these datasets contain the number of registered contracts to both, job seekers and non-job seekers, broken down by municipality, gender and contract type, between the years 2006-2020.
3.2. Tools.
R (versión 4.0.3) and RStudio with RMarkdown add-on have been used to carry out this analysis (working environment, programming and drafting).
RStudio is an integrated open source development environment for R programming language, dedicated to statistical analysis and graphs creation.
RMarkdown allows creation of reports integrating text, code and dynamic results into a single document.
To create interactive graphs, we have used Kibana tool.
Kibana is an open code application that forms a part of Elastic Stack (Elasticsearch, Beats, Logstasg y Kibana) qwhich provides visualization and exploration capacities of the data indexed on the analytics engine Elasticsearch. The main advantages of this tool are:
- Presents visual information through interactive and customisable dashboards using time intervals, filters faceted by range, geospatial coverage, among others
- Contains development tools catalogue (Dev Tools) to interact with data stored in Elasticsearch.
- It has a free version ready to use on your own computer and enterprise version that is developed in the Elastic cloud and other cloud infrastructures, such as Amazon Web Service (AWS).
On Elastic website you may find user manuals for the download and installation of the tool, but also how to create graphs, dashboards, etc. Furthermore, it offers short videos on the youtube channel and organizes webinars dedicated to explanation of diverse aspects related to Elastic Stack.
If you want to learn more about these and other tools which may help you with data processing, see the report “Data processing and visualization tools” that has been recently updated.
4. Data processing
To create a visualization, it´s necessary to prepare the data properly by performing a series of tasks that include pre-processing and exploratory data analysis (EDA), to understand better the data that we are dealing with. The objective is to identify data characteristics and detect possible anomalies or errors that could affect the quality of results. Data pre-processing is essential to ensure the consistency and effectiveness of analysis or visualizations that are created afterwards.
In order to support learning of readers who are not specialised in programming, the R code included below, which can be accessed by clicking on “Code” button, is not designed to be efficient but rather to be easy to understand. Therefore, it´s probable that the readers more advanced in this programming language may consider to code some of the functionalities in an alternative way. A reader will be able to reproduce this analysis if desired, as the source code is available on the datos.gob.es Github account. The way to provide the code is through a RMarkdown document. Once it´s loaded to the development environment, it may be easily run or modified.
4.1. Installation and import of libraries
R base package, which is always available when RStudio console is open, includes a wide set of functionalities to import data from external sources, carry out statistical analysis and obtain graphic representations. However, there are many tasks for which it´s required to resort to additional packages, incorporating functions and objects defined in them into the working environment. Some of them are already available in the system, but others should be downloaded and installed.
#Instalación de paquetes \r\n #El paquete dplyr presenta una colección de funciones para realizar de manera sencilla operaciones de manipulación de datos \r\n if (!requireNamespace(\"dplyr\", quietly = TRUE)) {install.packages(\"dplyr\")}\r\n #El paquete lubridate para el manejo de variables tipo fecha \r\n if (!requireNamespace(\"lubridate\", quietly = TRUE)) {install.packages(\"lubridate\")}\r\n#Carga de paquetes en el entorno de desarrollo \r\nlibrary (dplyr)\r\nlibrary (lubridate)\r\n4.2. Data import and cleansing
a. Import of datasets
Data which will be used for visualization are divided by annualities in the .CSV and .XLS files. All the files of interest should be imported to the development environment. To make this post easier to understand, the following code shows the upload of a single .CSV file into a data table.
To speed up the loading process in the development environment, it´s necessary to download the datasets required for this visualization to the working directory. The datasets are available on the datos.gob.es Github account.
#Carga del datasets de demandantes de empleo por municipio de 2020. \r\n Demandantes_empleo_2020 <- \r\n read.csv(\"Conjuntos de datos/Demandantes de empleo por Municipio/Dtes_empleo_por_municipios_2020_csv.csv\",\r\n sep=\";\", skip = 1, header = T)\r\nOnce all the datasets are uploaded as data tables in the development environment, they need to be merged in order to obtain a single dataset that includes all the years of the time series, for each of the characteristics related to job seekers that will be analysed: number of job seekers, unemployment expenditure and new contracts registered by SEPE.
#Dataset de demandantes de empleo\r\nDatos_desempleo <- rbind(Demandantes_empleo_2006, Demandantes_empleo_2007, Demandantes_empleo_2008, Demandantes_empleo_2009, \r\n Demandantes_empleo_2010, Demandantes_empleo_2011,Demandantes_empleo_2012, Demandantes_empleo_2013,\r\n Demandantes_empleo_2014, Demandantes_empleo_2015, Demandantes_empleo_2016, Demandantes_empleo_2017, \r\n Demandantes_empleo_2018, Demandantes_empleo_2019, Demandantes_empleo_2020) \r\n#Dataset de gasto en prestaciones por desempleo\r\ngasto_desempleo <- rbind(gasto_2010, gasto_2011, gasto_2012, gasto_2013, gasto_2014, gasto_2015, gasto_2016, gasto_2017, gasto_2018, gasto_2019, gasto_2020)\r\n#Dataset de nuevos contratos a demandantes de empleo\r\nContratos <- rbind(Contratos_2006, Contratos_2007, Contratos_2008, Contratos_2009,Contratos_2010, Contratos_2011, Contratos_2012, Contratos_2013, \r\n Contratos_2014, Contratos_2015, Contratos_2016, Contratos_2017, Contratos_2018, Contratos_2019, Contratos_2020)b. Selection of variables
Once the tables with three time series are obtained (number of job seekers, unemployment expenditure and new registered contracts), the variables of interest will be extracted and included in a new table.
First, the tables with job seekers (“unemployment_data”) and new registered contracts (“contracts”) should be added by province, to facilitate the visualization. They should match the breakdown by province of the unemployment benefits expenditure table (“unemployment_expentidure”). In this step, only the variables of interest will be selected from the three datasets.
#Realizamos un group by al dataset de \"datos_desempleo\", agruparemos las variables numéricas que nos interesen, en función de varias variables categóricas\r\nDtes_empleo_provincia <- Datos_desempleo %>% \r\n group_by(Código.mes, Comunidad.Autónoma, Provincia) %>%\r\n summarise(total.Dtes.Empleo = (sum(total.Dtes.Empleo)), Dtes.hombre.25 = (sum(Dtes.Empleo.hombre.edad...25)), \r\n Dtes.hombre.25.45 = (sum(Dtes.Empleo.hombre.edad.25..45)), Dtes.hombre.45 = (sum(Dtes.Empleo.hombre.edad...45)),\r\n Dtes.mujer.25 = (sum(Dtes.Empleo.mujer.edad...25)), Dtes.mujer.25.45 = (sum(Dtes.Empleo.mujer.edad.25..45)),\r\n Dtes.mujer.45 = (sum(Dtes.Empleo.mujer.edad...45)))\r\n#Realizamos un group by al dataset de \"contratos\", agruparemos las variables numericas que nos interesen en función de las varibles categóricas.\r\nContratos_provincia <- Contratos %>% \r\n group_by(Código.mes, Comunidad.Autónoma, Provincia) %>%\r\n summarise(Total.Contratos = (sum(Total.Contratos)),\r\n Contratos.iniciales.indefinidos.hombres = (sum(Contratos.iniciales.indefinidos.hombres)), \r\n Contratos.iniciales.temporales.hombres = (sum(Contratos.iniciales.temporales.hombres)), \r\n Contratos.iniciales.indefinidos.mujeres = (sum(Contratos.iniciales.indefinidos.mujeres)), \r\n Contratos.iniciales.temporales.mujeres = (sum(Contratos.iniciales.temporales.mujeres)))\r\n#Seleccionamos las variables que nos interesen del dataset de \"gasto_desempleo\"\r\ngasto_desempleo_nuevo <- gasto_desempleo %>% select(Código.mes, Comunidad.Autónoma, Provincia, Gasto.Total.Prestación, Gasto.Prestación.Contributiva)Secondly, the three tables should be merged into one that we will work with from this point onwards..
Caract_Dtes_empleo <- Reduce(merge, list(Dtes_empleo_provincia, gasto_desempleo_nuevo, Contratos_provincia))
c. Transformation of variables
When the table with variables of interest is created for further analysis and visualization, some of them should be transformed to other types, more adequate for future aggregations.
#Transformación de una variable fecha\r\nCaract_Dtes_empleo$Código.mes <- as.factor(Caract_Dtes_empleo$Código.mes)\r\nCaract_Dtes_empleo$Código.mes <- parse_date_time(Caract_Dtes_empleo$Código.mes(c(\"200601\", \"ym\")), truncated = 3)\r\n#Transformamos a variable numérica\r\nCaract_Dtes_empleo$Gasto.Total.Prestación <- as.numeric(Caract_Dtes_empleo$Gasto.Total.Prestación)\r\nCaract_Dtes_empleo$Gasto.Prestación.Contributiva <- as.numeric(Caract_Dtes_empleo$Gasto.Prestación.Contributiva)\r\n#Transformación a variable factor\r\nCaract_Dtes_empleo$Provincia <- as.factor(Caract_Dtes_empleo$Provincia)\r\nCaract_Dtes_empleo$Comunidad.Autónoma <- as.factor(Caract_Dtes_empleo$Comunidad.Autónoma)d. Exploratory analysis
Let´s see what variables and structure the new dataset presents.
str(Caract_Dtes_empleo)\r\nsummary(Caract_Dtes_empleo)The output of this portion of the code is omitted to facilitate reading. Main characteristics presented in the dataset are as follows:
- Time range covers a period from January to December 2020.
- Number of columns (variables) is 17. .
- It presents two categorical variables (“Province”, “Autonomous.Community”), one date variable (“Code.month”) and the rest are numerical variables.
e. Detection and processing of missing data
Next, we will analyse whether the dataset has missing values (NAs). A treatment or elimination of NAs is essential, otherwise it will not be possible to process properly the numerical variables.
any(is.na(Caract_Dtes_empleo)) \r\n#Como el resultado es \"TRUE\", eliminamos los datos perdidos del dataset, ya que no sabemos cual es la razón por la cual no se encuentran esos datos\r\nCaract_Dtes_empleo <- na.omit(Caract_Dtes_empleo)\r\nany(is.na(Caract_Dtes_empleo))4.3. Creation of new variables
In order to create a visualization, we are going to make a new variable from the two variables present in the data table. This operation is very common in the data analysis, as sometimes it´s interesting to work with calculated data (e.g., the sum or the average of different variables) instead of source data. In this case, we will calculate the average unemployment expenditure for each job seeker. For this purpose, variables of total expenditure per benefit (“Expenditure.Total.Benefit”) and the total number of job seekers (“total.JobSeekers.Employment”) will be used.
Caract_Dtes_empleo$gasto_desempleado <-\r\n (1000 * (Caract_Dtes_empleo$Gasto.Total.Prestación/\r\n Caract_Dtes_empleo$total.Dtes.Empleo))4.4. Save the dataset
Once the table containing variables of interest for analysis and visualizations is obtained, we will save it as a data file in CSV format to perform later other statistical analysis or use it within other processing or data visualization tools. It´s important to use the UTF-8 encoding (Unicode Transformation Format), so the special characters may be identified correctly by any other tool.
write.csv(Caract_Dtes_empleo,\r\n file=\"Caract_Dtes_empleo_UTF8.csv\",\r\n fileEncoding= \"UTF-8\")5. Creation of a visualization on the characteristics of employment demand in Spain using Kibana
The development of this interactive visualization has been performed with usage of Kibana in the local environment. We have followed Elastic company tutorial for both, download and installation of the software.
Below you may find a tutorial video related to the whole process of creating a visualization. In the video you may see the creation of dashboard with different interactive indicators by generating graphic representations of different types. The steps to build a dashboard are as follows:
A continuación se adjunta un vídeo tutorial donde se muestra todo el proceso de realización de la visualización. En el vídeo podrás ver la creación de un cuadro de mando (dashboard) con diferentes indicadores interactivos mediante la generación de representaciones gráficas de diferentes tipos. Los pasos para obtener el dashboard son los siguientes:
- Load the data into Elasticsearch and generate an index that allows to interact with the data from Kibana. This index permits a search and management of the data in the loaded files, practically in real time.
- Generate the following graphic representations:
- Line graph to represent a time series on the job seekers in Spain between 2006 and 2020.
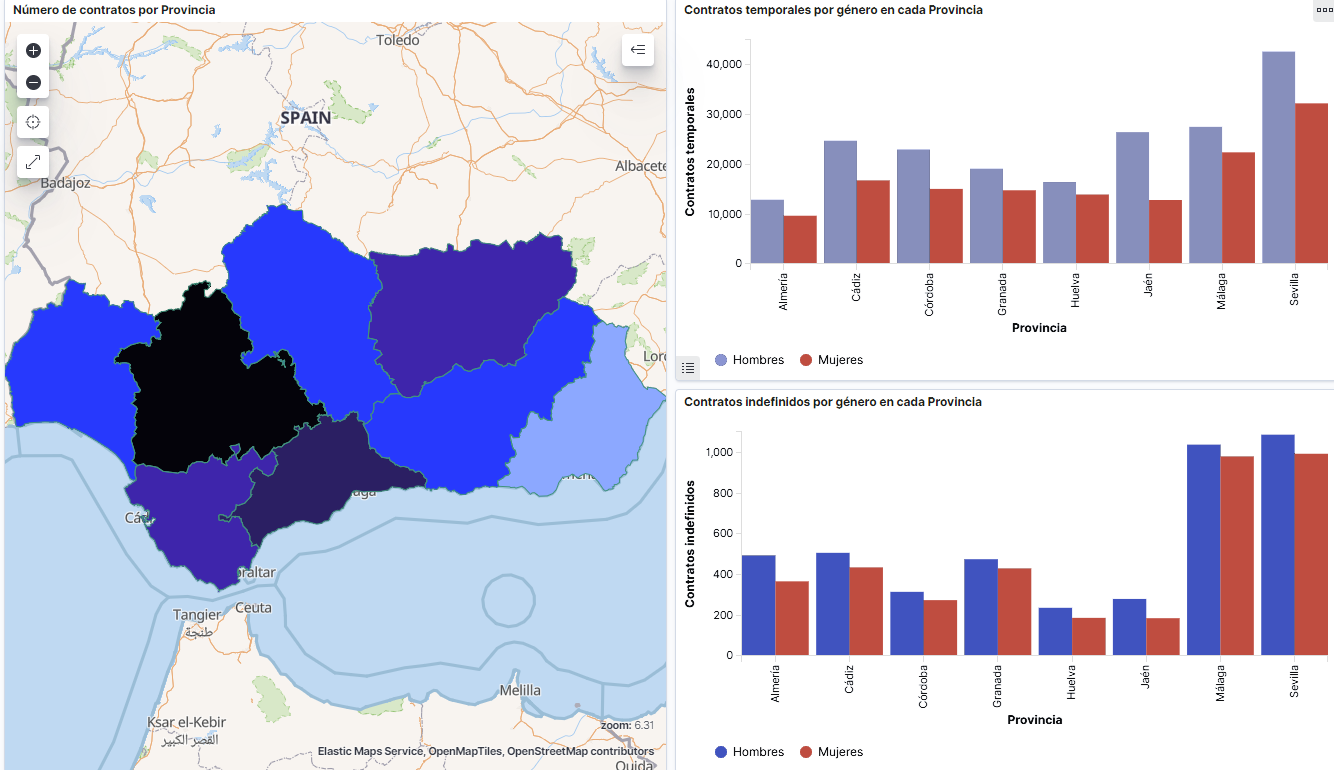
- Sector graph with job seekers broken down by province and Autonomous Community
- Thematic map showing the number of new contracts registered in each province on the territory. For creation of this visual it´s necessary to download a dataset with province georeferencing published in the open data portal Open Data Soft.
- Build a dashboard.
Below you may find a tutorial video interacting with the visualization that we have just created:
6. Conclusions
Looking at the visualization of the data related to the profile of job seekers in Spain during the years 2010-2020, the following conclusions may be drawn, among others:
- There are two significant increases of the job seekers number. The first, approximately in 2010, coincides with the economic crisis. The second, much more pronounced in 2020, coincides with the pandemic crisis.
- A gender gap may be observed in the group of job seekers: the number of female job seekers is higher throughout the time series, mainly in the age groups above 25.
- At the regional level, Andalusia, followed by Catalonia and Valencia, are the Autonomous Communities with the highest number of job seekers. In contrast to Andalusia, which is an Autonomous Community with the lowest unemployment expenditure, Catalonia presents the highest value.
- Temporal contracts are leading and the provinces which generate the highest number of contracts are Madrid and Barcelona, what coincides with the highest number of habitants, while on the other side, provinces with the lowest number of contracts are Soria, Ávila, Teruel and Cuenca, what coincides with the most depopulated areas of Spain.
This visualization has helped us to synthetise a large amount of information and give it a meaning, allowing to draw conclusions and, if necessary, make decisions based on results. We hope that you like this new post, we will be back to present you new reuses of open data. See you soon!
Blog
In the last year, we have seen how decisions on health matters have marked the political, social and economic agenda of our country, due to the global pandemic situation resulting from COVID-19. Decisions taken on the basis of public data on cumulative incidence, hospital bed occupancy or vaccination rates have marked our daily lives.
This fact highlights the importance of open health data for the management and decision-making of our governments, but it is also fundamental as a basis for solutions that help both patients and doctors.
The types of data used in the field of health and wellbeing are numerous: results of medical studies and research, anonymised patient records, data on patients' habits (such as how much exercise we do or how much sleep we get) or data linked to health services and management. All these data are of great value that can be exploited by healthcare professionals, providers and citizens alike.
How have health services been using open data?
According to the study "The Open Data Impact Map", a project of the Open Data for Development Network (OD4D), health-related organisations use open data mainly for the purpose of optimising their management and organisation of resources. Of the 124 organisations interviewed in 2018, only 19 indicated that they use open data for the development of health products and services, and only 13 for research. The same study indicates that the most widely used open data are those directly related to health, and that very few organisations combine them with datasets from other themes - mainly geospatial or demographic or social indicators - to generate deeper and more detailed knowledge.
However, the opportunities in this field are vast, as shown below.
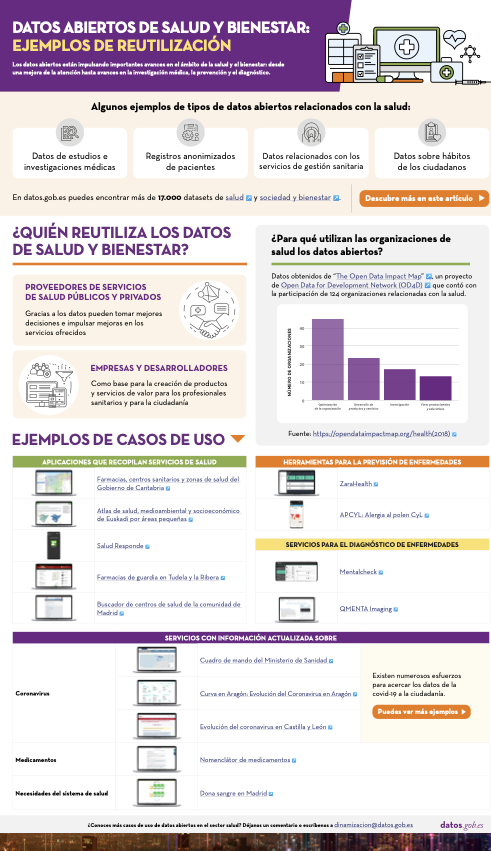
Click here to see the infographic in full size and in its accessible version
Examples of services based on open health data
The situation seems to be changing and there is increasing momentum for the implementation of applications, services or projects based on data in this field. Europe is committed to the creation of data spaces focused on the field of health, as part of its strategy to build a European cloud, while the Spanish government has included the promotion of Digital Health solutions in its Digital Spain 2025 strategy. Among the actions envisaged by our country is the streamlining of information systems to enable better data sharing and interoperability.
Applications that collect health services
When it comes to health apps, the most common are those that help citizens find local healthcare providers that meet their needs. An example is 24-hour pharmacies in Tudela and la Ribera or the search engine for health centres in the community of Madrid. Thanks to these, patients can find out where the centres are located and find out information of interest, such as opening hours. Some applications include additional services, such as Salud Responde, from the Junta de Andalucía, which allows the request and modification of medical appointments, improving the efficiency of the system.
But such services can also provide important information for more efficient resource management, especially when cross-referenced with other datasets. For example, Pharmacies, Health Centres and Health Areas of the Government of Cantabria, developed by Esri, includes information on the territorial organisation of health resources according to geographical, demographic, epidemiological, socio-economic, labour, cultural, climatological and transport factors. Its main objective is not only to facilitate citizens' access to this information, but also to ensure that "the provision of health services is carried out in the best conditions of accessibility, efficiency and quality".
The Health, environmental and socio-economic atlas of the Basque Country by small areas shows a series of maps with the aim of "monitoring geographical inequalities in health, socioeconomic and environmental indicators in the Basque Country, taking into account the gender perspective". This information is very useful for service managers in trying to promote greater equity in access to healthcare.
Disease prevention tools
There are also applications on the market aimed at disease prevention, such as ZaraHealth, a web application that displays real-time data on water quality, air quality and pollen levels in the city of Zaragoza. The user can set a series of thresholds for pollen and pollution levels, so that a warning is issued when they are reached. In this way, they can avoid going outdoors or exercising in areas that do not meet their needs. APCYL: Allergy to pollen CyL has the same goal.
Another important aspect of our health is our diet, a key factor in the prevention of various pathologies such as cardiovascular diseases or diabetes. Websites such as Mils, which offers detailed nutritional information on food, can help us to eat more healthily.
Services for the diagnosis and treatment of diseases
Open data can help assess health outcomes, develop more effective treatments and predict disease outbreaks.
In the field of mental health, for example, we find Mentalcheck, an app that enables psychological assessments and self-reporting via mobile devices. It aims to improve Ecological Momentary Assessment and Intervention (EMA and EMI). The application incorporates open data on medications and mental health services from the US Food and Drug Administration (FDA). It also allows the integration of psychological and physiological data to generate correlations.
Another example is Qmenta, a company focused on analysing brain data, using MRI and related clinical data. In recent months they have also incorporated open data related to COVID-19 in some of their work. Through medical image processing algorithms, they seek to accelerate the development of new therapies for neurological diseases.
Up-to-date information on diseases or system needs
Another area where open data can drive improvements is in the reporting of certain situations. This has become especially important in the context of the global pandemic where citizens demand constant and updated information. In this sense, we find the scorecard of the Ministry of Health at state level and different regional initiatives, such as Curve in Aragon: Evolution of Coronavirus in Aragon, or Evolution of the coronavirus in Castilla y León. These are just a couple of examples, but it should be noted that there are numerous efforts in this area, as the Ministry of Health reports on its website.
It is also important to make information on medicines transparent, both for doctors and patients, by facilitating comparisons. In this regard, the Nomenclature of Medicines shows more than 20,000 medicines marketed in Spain with Social Security coverage, offering information on price, presentation, links to the package leaflet, safety notes and active ingredients, among others.
Finally, it is also important to provide information on resource needs, for example, doctor vacancies or the state of blood reserves.
Data in general has driven important advances in improving health outcomes, from increased access to care to medical research and diagnosis. Open data is a key ingredient that can help further enrich these solutions with new variables. It is therefore essential that more and more health and wellness data will be opened, following a set of guidelines and standards that ensure the privacy and security of patients. In this sense, the report "Open data and health: technological context, stakeholders and legal framework" includes information on what types of data can be opened and what the legal framework says about it.
Do you know more use cases of open data applied to the health and welfare sector? Leave us a comment or write to dinamizacion@datos.gob.es.
Content prepared by the datos.gob.es team.
Blog
Open data is a source of information for the development of smart services, as well as for decision-making and policy-making. It is therefore not surprising that an increasing number of public bodies, in addition to opening data - for reuse by others and for reasons of accountability and transparency - are also reusing their own data for different purposes.
In this sense, the rise of smart city management platforms is encouraging many city councils and autonomous communities to develop smart applications and tools that take advantage of the use of data and analytical techniques to innovate and improve the public services they offer to citizens. Below, we show you several examples.
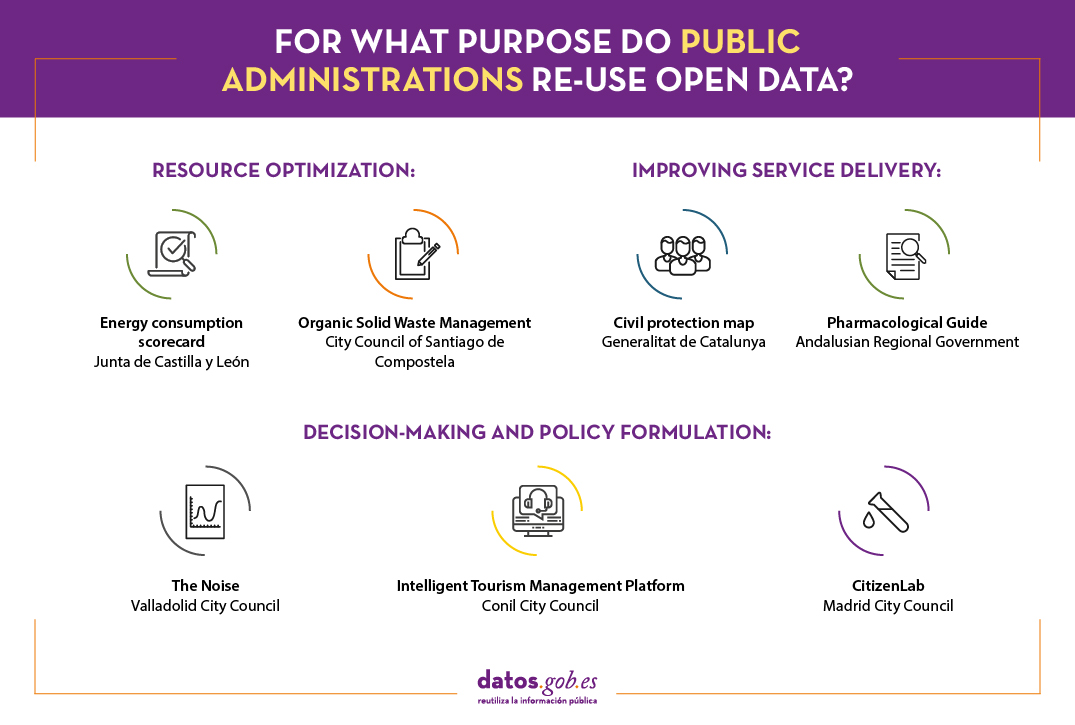
Resource optimisation
Open data can be used by public bodies to understand how public resources are being managed, as well as to promote actions that enable more efficient management and economic savings, e.g. in terms of energy consumption or by promoting more efficient resource management.
Energy consumption scorecard. Junta de Castilla y León.
This energy datahub, developed by the open data initiative of the Junta de Castilla y León, offers detailed and visual information on energy consumption in the centres managed by the Junta, such as educational centres, health centres, administrative offices or hospitals, among others.
It is a scorecard that gathers information from more than 1,500 consumption centres, offering different types of graphical representations that make it easier for the reader to understand the data. The data source used for the development of this platform can be consulted via this link.
The tool facilitates disaggregated analysis by type of energy and geographical location. This information may be of interest to citizens, but also to the Board's own managers. Thanks to this platform, between 2015 and the beginning of 2020, the Board saved more than 12 million euros in electricity.
In addition, the regional government has an electricity table that focuses exclusively on the electricity consumption of hospitals in Castilla y León on an hourly basis. The data is linked to meteorological information, so that future costs can be estimated and the use of heating can be optimised. The data used to develop this table can be consulted here.
Organic solid waste management. City Council of Santiago de Compostela.
The City Council of Santiago de Compostela has launched, within the Smartiago initiative, a project that aims to achieve a sustainable and intelligent management of municipal solid waste (MSW). The main objective of this tool is to design, develop and build smart surface containers for the characterisation of organic solid waste, based on the use of open IoT technologies, the application of machine learning algorithms and the use of open data as sources for the enrichment of community composting prediction models. This aims to achieve the 50% readiness for reuse and recycling target, up from the current 13%. The project, currently under development, will also include a gamification app to encourage good practices in sustainability.
Improving service delivery
Thanks to open data it is also possible to create tools for social service professionals to provide a better response and attention to the needs of citizens. Let's look at a couple of examples:
Civil protection map. Generalitat de Catalunya.
This interactive map shows the main resources of the civil protection system in Catalonia. The civil protection map allows you to see where the different risks are located (technological, environmental...) and the situation of the teams in order to better plan responses. Here you can consult the main source of data used by this tool.
Pharmacological Guide. Andalusian Regional Government.
This application has been designed by the Andalusian Regional Government to offer healthcare professionals a faster and more efficient consultation of the main drugs used in emergency care in Andalusia. It is a useful working tool for those healthcare professionals who aid in critical situations as it includes constantly updated and contrasted information on the main indications, doses, contraindications and interactions of the most commonly used drugs.
Decision-making and policy formulation
Open data provides greater knowledge about what is happening around us, enabling us to make better decisions. It is a very useful tool for public bodies to develop policies that respond to the real needs of citizens. Over the last year, we have seen how measures to prevent the spread of COVID-19 have been taken on the basis of data on the evolution of the disease. Other examples are:
The Noise Map. Valladolid City Council.
Valladolid City Council has a Noise Map that organises information on noise pollution. This map has been developed to be used in a compulsory way in the execution of the calculations foreseen in the different regulatory standards, as well as in the technical building code and which will apply to residential, institutional and industrial buildings, as well as in the technical building code and which will apply to residential, institutional and industrial buildings.
Intelligent tourism management platform. Conil Town Council.
Within the framework of Red.es' Smart Cities, Territories and Islands calls for proposals, we are finding more and more proposals that include the development of data management platforms that promote efficient decision-making. One example is the City Council of Conil de la Frontera, which is working with a smart tourism management platform to increase the knowledge of tourists, through the aggregation and centralisation of data related to the origin of the tourist, mobility and most visited areas, preferred places to visit and stay overnight or satisfaction surveys, among other parameters. In this way, the local administration can identify patterns and carry out actions to adapt and improve management, detect irregularities, promote economic and business development or favour the generation of employment in the priority areas identified. These data have also been used to estimate the real population during the pandemic and to make a better estimate of incidence rates. Although these data do not appear to be public for the moment, the aim is to open them to companies through an open data platform.
CitizenLab. Madrid City Council.
The regional government of Madrid, together with Grant Thornton, has launched a datalab to better understand citizen behaviour. The project seeks to analyse predictive models of citizen behaviour using Big Data and Artificial Intelligence (AI), with the aim of improving public services in the Madrid region in areas such as mobility, healthcare, tourism and infrastructure. In the last year, for example, it has been used to predict the demand for vaccines.
Undoubtedly, there are numerous applications and digital tools used by public administrations - and it seems that there will be more - that base their operation on open data to offer more and better services to citizens. In this article we have compiled some examples, but if you know of any related ones that may be of interest, do not hesitate to leave a comment or write to us at our email address dinamizacion@datos.gob.es.
Content prepared by the datos.gob.es team.
Evento
On 23, 24 and 25 November, the first edition of EU Open Data Days will take place, which can be followed online. Organised by the Publications Office and the Presidency of the Council of the European Union, the aim of the event is to promote open data, showing the value of the different business models based on them.
The event will be divided into 3 days: the first two days will be dedicated to the EU DataViz 2021 conference, focusing on open data and data visualisations, while the last day will be dedicated to the final of the EU Datathon 2021.
EU Dataviz 2021
The EU Dataviz 2021 conference will feature experts addressing techniques and best practices related to open data and its reuse in both the private and public sectors.
The content of the event has been built collaboratively. Between March and May this year, citizens from all over the world had the opportunity to submit their thematic proposals to participate as speakers. From the more than 150 proposals received, the EU DataViz 2021 Programme Committee selected the ones chosen to form the final agenda, which will take up two days.
23 November 2021: Open data
La primera jornada arrojará luz sobre los datos abiertos como base de soluciones que den forma al futuro digital de Europa.
The first day will shed light on open data as the basis for solutions to shape Europe's digital future.
It will be opened by the Director-General of the Publications Office of the European Union. Xavier Bettel, Prime Minister of Luxembourg, will follow with a presentation on data and digitisation at the heart of Luxembourg's innovation. This will be followed by a plenary session - with 30-45 minutes talks showcasing best practices, new use cases and emerging trends - and three thematic sessions - 45-60 minutes, with a more practical focus-:
- Plenary session. It will address the EU's data strategy and its path towards a single European market, as well as the situation of open data in Europe. There will also be a round table dedicated to data intelligence and its conversion into informed decisions. The Spanish side will be presented by Nuria Oliver, Co-Founder and Vice-President of ELLIS - European Laboratory for Learning and Intelligent Systems (Spain), who will talk about Valencia's experience in using data science in the fight against COVID-19.
- Thematic session 1: Creating open data ecosystems. Examples of projects contributing to open data policies, such as the European water health open knowledge (WHOW) project, will be showcased.
- Thematic session 2: Data for people. The importance of citizen participation and user-oriented projects in the field of open data will be highlighted. Among the projects to be showcased, we highlight the presentation by Antonio Ibáñez, Head of Transparency and Re-use of Information of Castilla y León, who will talk about transparency and open data in the health service of the region.
- Thematic session 3: Facilitating data reuse. Focusing on the enablers of open data, such as FAIR principles, digital literacy or mechanisms to ensure interoperability.
24 November 2021: Data visualisation
This conference will address the importance of communicating data efficiently. It will provide good practices and techniques to build data narratives and ensure better service to citizens.
After the opening by Boštjan Koritnik, Minister of Public Administration of Slovenia, representing the Presidency of the Council of the European Union, plenary and thematic sessions will also take place.
- Plenary session. It will consist of three presentations "Data visualisation as a vector of innovation: the case of lawyers", " Applying diverse, equitable and inclusive awareness in data visualisation" and " Opening EU climate open data through data storytelling".
- Thematic session 1: From open data to data visualisation. This session will serve as a bridge between open data and data visualisation. It will discuss storytelling and empowering citizens to turn open data into insights, among other issues.
- Thematic session 2: Serving citizens with dataviz. It will focus on how to involve citizens' needs in the process of creating visualisations and will offer concrete tips, for example for data visualisations on mobile phones.
- Thematic session 3: Using dataviz for policy making. It will show how data visualisation can support the decision-making cycle, with a particular focus on the EU public sector.
EU datathon 2021
The EU Datathon 2021 final will take place on 25 November. The nine finalist teams will present their solutions to the jury, which will evaluate each proposal and determine the final classification in the different categories. Among the finalists is Spain's CleanSpot, an app that seeks to encourage recycling through gamification.
The thematic challenges will be presented by a panel of experts and the event will close with an awards ceremony.
How can I attend?
Registration is free of charge. The different presentations can be followed online, but registration is required. Register and discover the latest trends and use cases of open data!
Blog
Did you know that opening information in sectors such as housing can help you find your new home? Moving house is not usually an easy decision and some doubts may arise, such as whether it is more profitable to buy or rent, what services are available in each neighbourhood of the city or what is the approximate price of housing on the market.
The data provided by public bodies can help us find answers to these and many other questions. This data can be used to create tools and applications that, in a simple and user-friendly way, allow us to compare parameters and make better decisions, some of which we have already collected in a previous article. On this occasion we update the information including 10 new use cases, offered by public and private organisations, which can offer you information of interest to find your new home.
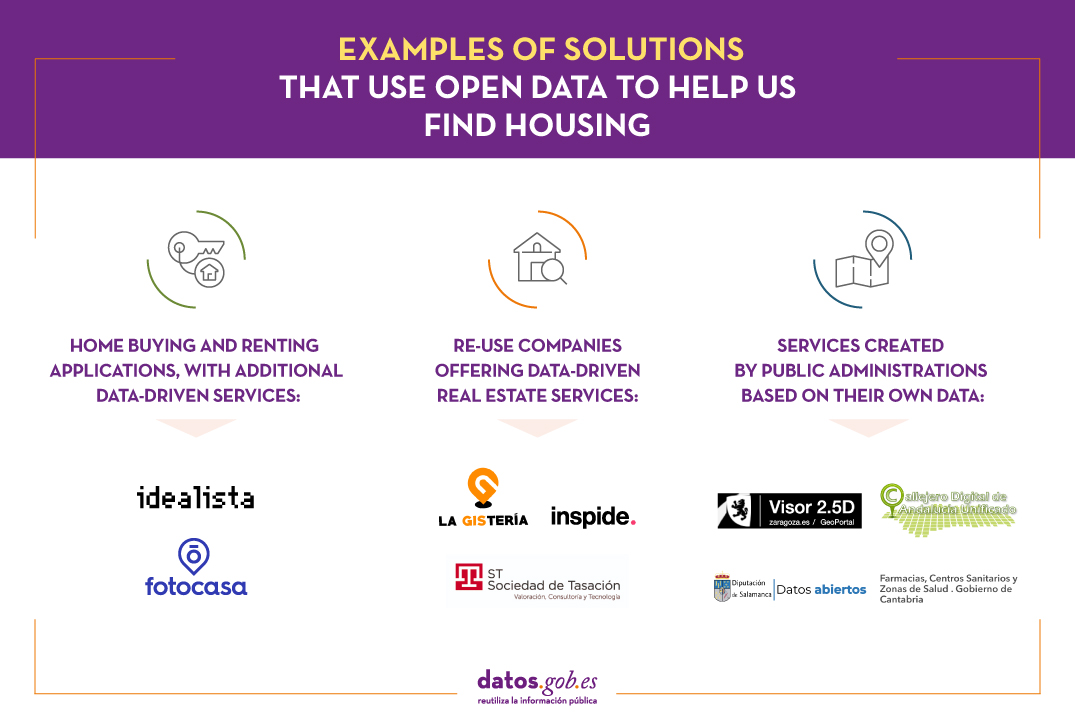
Home buying and renting applications offering additional data-driven services
There are currently numerous digital tools and applications that provide users with information about property listings for sale or rent. Some of these companies also offer additional services based on data that provide a better understanding of the market. Let's look at two examples.
- Idealista. In Idealista, users can find an analysis based on data from the real estate market in Spain, Portugal and Italy. To do so, they use data from both public sources (for example, from the Cadastre, the National Geographic Institute or the INE) and private sources from the idealista.com portal itself. It also has a set of technological tools - including the possibility of accessing the platform's data through an API - and information analysis tools to process, homogenise and structure useful data sources and transform them into easily accessible information. An example is the map of average sales price per square metre or its prediction of how much solar energy could be generated by all the municipalities in Spain.
- Fotocasa. This platform provides users with interactive maps with data from its Real Estate Index to know, in real time, the sale and rental price per m2 according to the supply of homes that are advertised on the real estate portal. Fotocasa encourages the use of open data, making it possible to use this valuable data to measure the market.
Re-use companies
In the market we also find companies specialised in data reuse, which exploit their potential to create services of interest in the real estate field. Some examples are:
- La Gistería. This consultancy company specialises in data visualisations using GIS technologies. Together with Geomarketing inmobiliario de Madrid, they have created 27 maps delimited by zones, positioning the points of interest in different areas such as health, leisure, or education. These maps have been created using the open data of the Madrid City Council and the brand identity of the real estate company Engel & Volkers in order to integrate it into their website and facilitate the search for a flat by users.
- Inspide. Through a web application, it allows to know if a city like Madrid adapts to the requirements of social distancing derived from the current pandemic situation and what urban actions could solve this problem. Inspide shows, for example, the width of the pavements represented with colours, and specifies whether their width is adequate to maintain the required distance between pedestrians. This is a very interesting application if we want to find a wide neighbourhood with wide streets in which to buy our next home.
- Sociedad de Tasación. This is an independent appraisal company that offers valuations of all types of assets, especially real estate assets. It offers valuation, consultancy and technological services, such as the use of Big Data and Artificial Intelligence applied to the Real Estate Sector. To implement its services, it uses its own data as well as public data from the Cadastre, the statistical portal of the Registrars, or the General Council of Notaries.
Services created by the public administrations themselves based on their data
It is not only private companies that create solutions based on open data. Local councils and public bodies also provide their citizens with applications and digital tools that show open information of interest when deciding, for example, on the location in which to buy a new home.
- Interactive Viewer of Zaragoza. Zaragoza City Council, through its geoportal, has included an interactive viewer that allows you to see the city's buildings and the shadows they cast on the streets. This new virtual map is accessible to all citizens. The interactive viewer offers an innovative vision of the city that can be of help if we want relevant information about the orientation and exposure to the sun that a certain area of Zaragoza has.
- Digital street map of Andalusia. It allows the search of postal addresses in all the municipalities of Andalusia using the information of roads and portals of the CDAU project (Unified Digital Street Map of Andalusia). It is also possible to locate other points of interest, in addition to postal addresses, using data from the DERA product (Spatial Reference Data of Andalusia). If you are thinking of looking for an area that meets the characteristics you need to buy or rent a property in Andalusia, this application can help you.
- Network of Crecemos centres in the province of Salamanca. The open data portal of the Provincial Council of Salamanca offers through its website public information on the Crecemos network of centres in the province of Salamanca. This network is part of the 'Crecemos' programme of the Junta de Castilla y León, which facilitates work-life balance in rural areas, as well as helping to generate employment and fix the population in the area. Among other information, it analyses the places where it is easier to reconcile work and personal life, which is very useful for users to know where to buy a house. The portal offers the possibility of downloading this data in various formats, such as XSLX, CSV or XML.
- Pharmacies, Health Centres and Health Areas. How many pharmacies and health centres are there in the area where you want to buy your new home? How far are they from your location? This service shows the health map of Cantabria to offer its users data about the location of pharmacies and hospitals in each area of the autonomous community.
Undoubtedly, there are numerous digital tools and applications that base their services on open data to offer information about the real estate market to their users. If you know of any other tool based on open data that you think may be of interest to us, do not hesitate to leave us a comment or send us an email to dinamizacion@datos.gob.es.
Content prepared by the datos.gob.es team.
Blog
Mobility is a key economic driver. Increasing the efficiency and quality of a country's mobility system contributes both to the strength of its economy and to improving the quality of life of its citizens. This is particularly important in the mobility systems of cities and their metropolitan areas, where most of the population and, thus, most of the economic activity is concentrated.
Aware of this - and because we citizens demand it - local authorities have for decades allocated a significant part of their annual resources to expanding, improving and making their transport and mobility networks more efficient.
In the last decade, open data has been one of the most important vectors of innovation that have been introduced in the mobility strategies developed by cities, giving rise to initiatives that would have been difficult to imagine in previous periods. Despite all the complexities involved, opening both static and real-time mobility datasets for reuse is actually cheap and simple compared to the cost of building a new transport infrastructure or the cost of acquiring and maintaining the operational support systems (OSS) associated with mobility services. In addition, the existence of an increasing deployment of sensor networks, accessible through control systems deployed in the context of "smart city" strategies, makes the task a little easier.
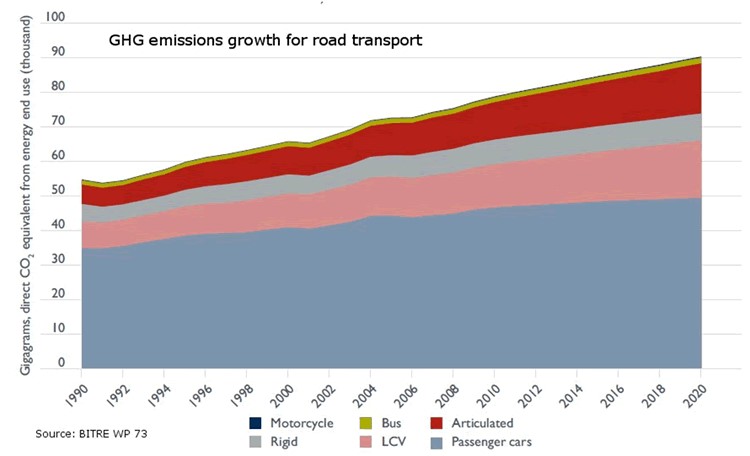
We should not forget, moreover, that public transport is key to tackling climate change as it is one of the fastest growing sources of greenhouse gas emissions, and public transport offers the best mobility solution to move people quickly and efficiently in cities around the world. As shown in the figure, simply shifting passengers using their private vehicles to public transport has a major impact on reducing greenhouse gas emissions. The Bus Industry Confederation estimates that shifting passengers from cars to public transport can lead to a 65% reduction in emissions during peak hours. This reduction could be as high as 95% in emissions during off-peak hours for those commuters who switch from private cars to public transport.
For all these reasons, there are already numerous examples where freeing up transport and mobility data to put it in the hands of travellers is proving to be a policy with important benefits for many cities: it allows better use of resources and contributes to more efficient mobility in urban space.
Let's look at some examples that may not be as well-known as the ones that usually reach the media, but which demonstrate how the release of data allows for innovations that benefit both users and, in some cases, the authorities themselves.
Redesigning New York City bus routes
All cities are constantly thinking of ways to improve their bus routes in order to provide the best possible service to citizens. In New York City, however, the open data policy, as an unplanned consequence, provided an important aid to the authorities, based on the analysis of data from the bus network users themselves.
The rider-driven Bus Turnaround Coalition campaign, supported by TransitCenter, a foundation working to improve public transport in US cities, and the Riders Alliance, is using open data to raise awareness about the state of New York City's bus network, proposing solutions for improvement to the Metropolitan Transportation Authority (MTA).
To formulate their recommendations, the organisations analysed bus arrival times using the MTA's own location maps, incorporated real-time data through the GTFS specification, reviewed ridership data, and mapped (and optimised) bus routes.
Among the most innovative proposals is the shift in approach to route design criteria. Instead of trying to cater to all types of travellers, the Bus Turnaround Coalition, after analysing how people actually move around the city and what type of transport they would need to achieve their goals efficiently, proposed the following recommendations:
- Add lines to take passengers from the outskirts of the city directly to the underground lines, facilitating a quick trip.
- Improve lines to offer short, fast routes within a neighbourhood for people who want to run a quick errand or visit a close friend.
- Split routes that are too long to minimise the risk of delays.
- Readjust the distance between stops, which are often too close together, complementing gaps in metro coverage.
Open data has turned frequent rider protests and complaints about poor network performance into a set of reasoned, data-driven inputs, which have been captured in a series of MTA commitments to improve New York's bus network, such as redesigning the network by 2021, increasing journey speeds by 25%, and proactively managing bus maintenance.
Bicycle usage data in San Francisco
Like many other cities, San Francisco, through its Municipal Transportation Agency (SFMTA), records travel data from users of its public bike-sharing system and makes it available as open data. In this case, the transport authority itself publishes regular reports, both on the overall use of the system and on the conclusions it draws for the improvement of the city's own mobility.
By documenting and analysing the volumes and trends of bicycle use in San Francisco, they are able to support the goals of the SFMTA's Strategic Plan, which aims to prioritise other forms of travel in the city than the private car.
For example, ongoing analysis of bicycle passenger volumes at key intersections in the city and citizen input has reduced traffic congestion and accidents by re-prioritising vehicle traffic priorities according to actual roadway usage at any given time of day.
Efficient parking in Sacramento
Many cities try to address traffic congestion problems from different perspectives including efficient parking management. Therefore, one of the datasets frequently published by cities with open data initiatives is public parking occupancy.
In the city of Sacramento, California, the open data initiative publishes datasets from the citywide sensor network that monitors parking availability at parking meters and not only in the city's public car parks. In this way they have managed to reduce emissions as vehicles spend less time looking for parking, while significantly improving traffic flow and the satisfaction of citizens using the Sacpark app.
In 2020, due to the pandemic, passenger transport around the world was drastically reduced due to the mobility restriction policies that governments around the world had to deploy to curb the spread of the virus, as seen in the image below.
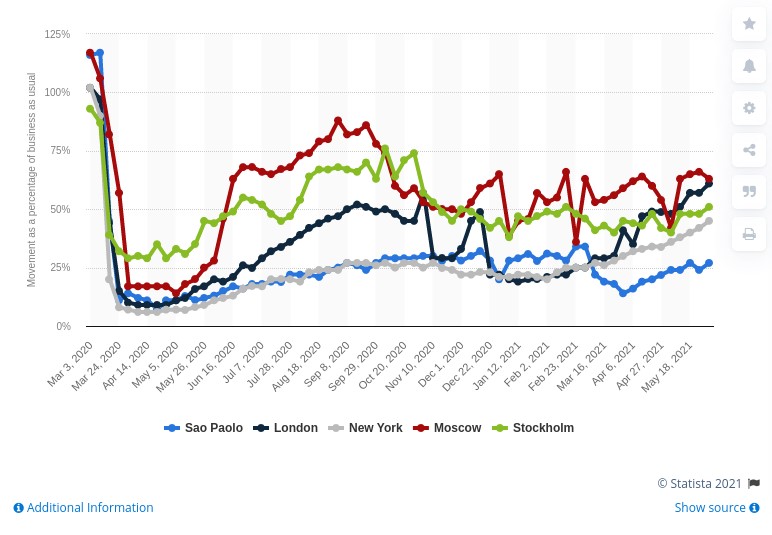
In June 2021 cities are still far from recovering the levels of mobility they had in March 2020, but we continue to make progress in making data the basis on which to build useful information, and essential in the new innovations coming through artificial intelligence.
So, as the pandemic recedes, and many initiatives resume, we continue to see how open data is at the heart of smart, connected and environmentally friendly mobility strategies.
Content prepared by Jose Luis Marín, Senior Consultant in Data, Strategy, Innovation & Digitalization.
The contents and views reflected in this publication are the sole responsibility of the author.
Evento
The University of Alicante will host the International Congress on Open Data and Reuse of Public Sector Information. The event will focus on the role of open data and its potential reuse to achieve improvements in several key areas for our country, such as tourism and the economy. It will also address the analysis and legal implications of Directive (EU) 2019/1024 of the European Parliament and of the Council of 20 June 2019 on open data and the re-use of public sector information.
This conference is part of the Project "Challenges of the Ministry PID2019-105736GB-I00DER: Open data and reuse of public sector information in the context of its digital transformation: adapting to the new regulatory framework of the European Union", whose principal investigators are Julián Valero Torrijos and Rubén Martínez Gutiérrez, and the Transparency Agreement between the University of Alicante and the Department of Participation, Transparency, Cooperation and Democratic Quality 2021.
Timetable and agenda
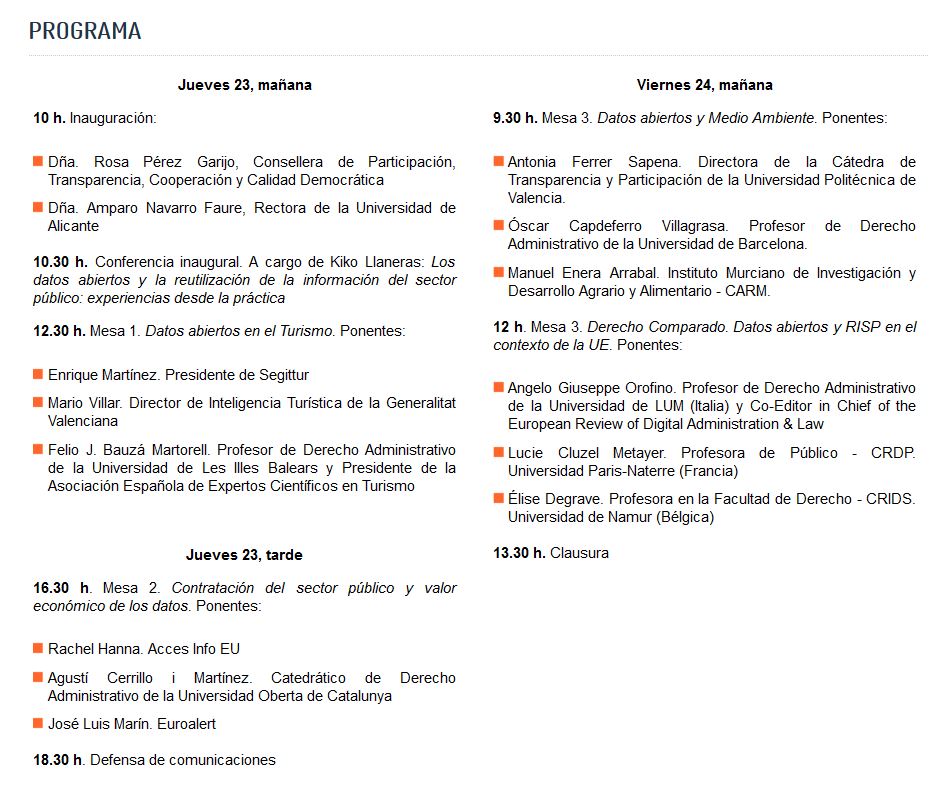
The Congress will take place on 23 and 24 September 2021 in online and face-to-face mode.
The opening will be given by Rosa Pérez Garijo, Councillor for Participation, Transparency, Cooperation and Democratic Quality of the Generalitat Valenciana, and Amparo Navarro Faure, Rector of the University of Alicante.
Next, Kiko Llaneras will be in charge of the inaugural conference with his speech "Open data and the reuse of public sector information: experiences from practice". Kiko Llaneras is known for his articles on data journalism in El País, where he analyses certain aspects of political, social and economic current affairs based on indicators, statistics and surveys, among other data sources.
The congress will then be based on 4 round tables, titled:
- Open Data in Tourism
- Contracting and the economic value of data
- Open Data and the Environment
- Comparative Law. Open Data and RISP in the EU context.
Each of these round tables will be attended by experts and professionals from the public, private and academic sectors. You can see the full programme here (only available in Spanish).
Do you want to participate in the Congress? There is still time to send your papers
The Congress is open to the participation of citizens and companies that want to share their knowledge and experience. Proposals related to the four round tables can be submitted, although free themes will also be accepted as long as they are in line with the objectives of the congress.
Papers must be submitted before 15 July using this form. The application consists of an abstract of a maximum of 400 words detailing the proposal. On the 21st of the same month, the organisers will send notification of acceptance of the papers, which must be defended publicly.
How to attend?
The event is free of charge, but places are limited. In order to attend, this form must be completed before 20 September 2021 at 23:59 hours. Admitted participants will receive confirmation of their registration by email.
When pre-registering, you must indicate whether you wish to attend in person or virtually. Those who choose the online option will receive an email with the link to the video call platform.
If you have any questions, you can write to cursos.deje@ua.es for administrative matters and to ruben.martinez@ua.es for academic matters.
Noticia
After months of work, the 3rd Aporta Challenge has come to an end. Under the slogan "the value of data in digital education", this year's competition sought solutions that used open data to drive improvements in the education sector.
The competition, organised by the Aporta Initiative, launched by Red.es together with the Secretary of State for Digitalisation and Artificial Intelligence, began in October 2020, with a first phase consisting of an ideas competition. After the jury's assessment, 10 finalists were chosen and have had three months to transform their ideas into a prototype. These prototypes were presented on 22 June in an online session.
10 proposals that stand out for their quality
The 10 papers presented are a great example of the power of open data to transform the education sector, improving its effectiveness and efficiency. The need for universal access to knowledge through inclusive and quality education has become even more evident in the current pandemic context. Open data can help to meet this challenge. Open data can be analysed and used to shape solutions that help to improve the student experience in the learning process, for example through personalisation of education, identification of behavioural problems or informed decision-making, among other issues.
All the entries were of a high quality, reflecting the efforts of all the finalist teams. The jury, made up of experts representing companies, public administrations and organisations linked to the digital economy and the academic world, had a difficult time choosing the three winners. In the end, the three winners were UniversiDATA-Lab, MIP Project and EducaWood, who received prizes of €4,000, €3,000 and €2,000 respectively.
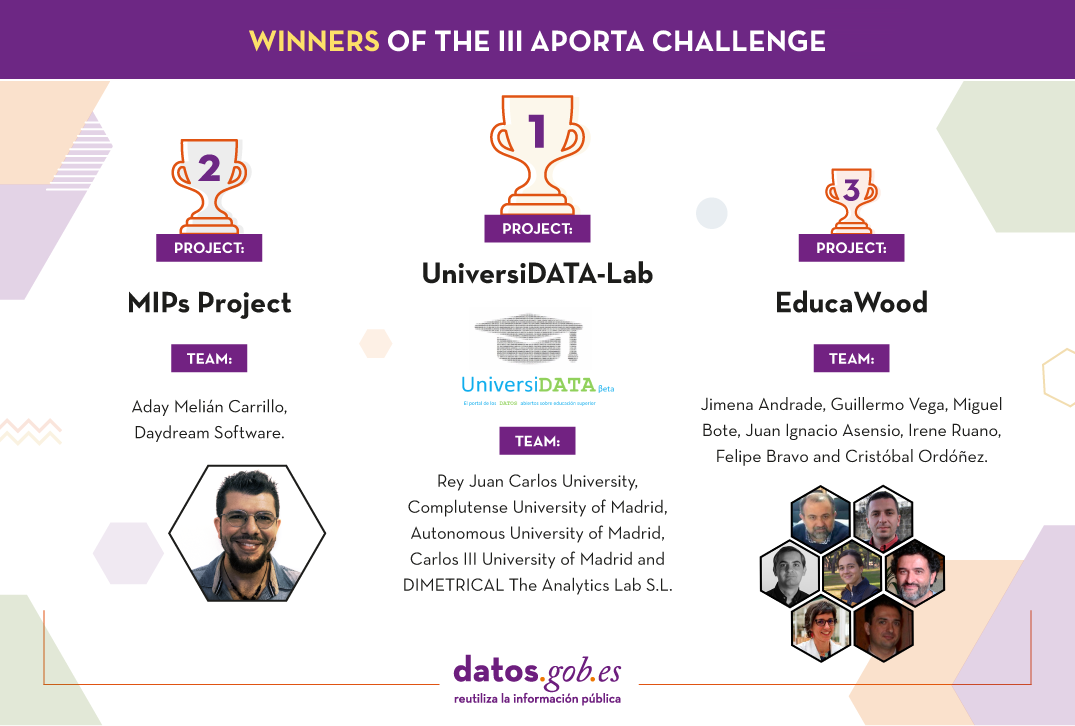
First prize: UniversiDATA-Lab
-
Team: Rey Juan Carlos University, Complutense University of Madrid, Autonomous University of Madrid, Carlos III University of Madrid and DIMETRICAL The Analytics Lab S.L.
The first prize went to UniversiData-Lab, a public portal for the advanced and automatic analysis of datasets published by universities. It is a complementary project to UniversiData: while the objective of UniversiDATA is to facilitate access to high quality university datasets with standard formats and criteria, the objective of UniversiDATA-Lab is to enhance the value of these datasets, carrying out advanced and automatic analysis of them, taking advantage of the homogeneity of the content.
UniversiDATA-Lab offers a catalogue of applications created thanks to the application of advanced analysis and visualisation techniques, carried out in R language. In the online session they showed the analysis of interurban commuting, the analysis of CO2 generated by student commuting and the analysis of gender differences in the different university branches.
These analyses can be instrumental in helping universities to make decisions related to administration and management, with major benefits for the environment, the economy and society.
Screenshots of UniversiDATA-Lab
Second prize: MIP Project
- Team: Aday Melián Carrillo, Daydream Software.
MIP Project, the second prize winner, is an online service where any user can register and start creating MIPs (Marked Information Pictures). A MIP is an information format consisting of a series of interactive layers over static images that facilitate the retention of information and the identification of elements.
The prototype includes a Python converter from GeoJSON open data to the format needed to develop interactive atlases. It also offers a public cloud of freely accessible MIPs for consultation, study or independent learning.
Thanks to this tool, teachers can create MIPs quickly and easily by manually drawing regions of interest on any image imported through the web. A more enjoyable way to educate and to attract students' attention more easily.
Screenshots of MIP Project
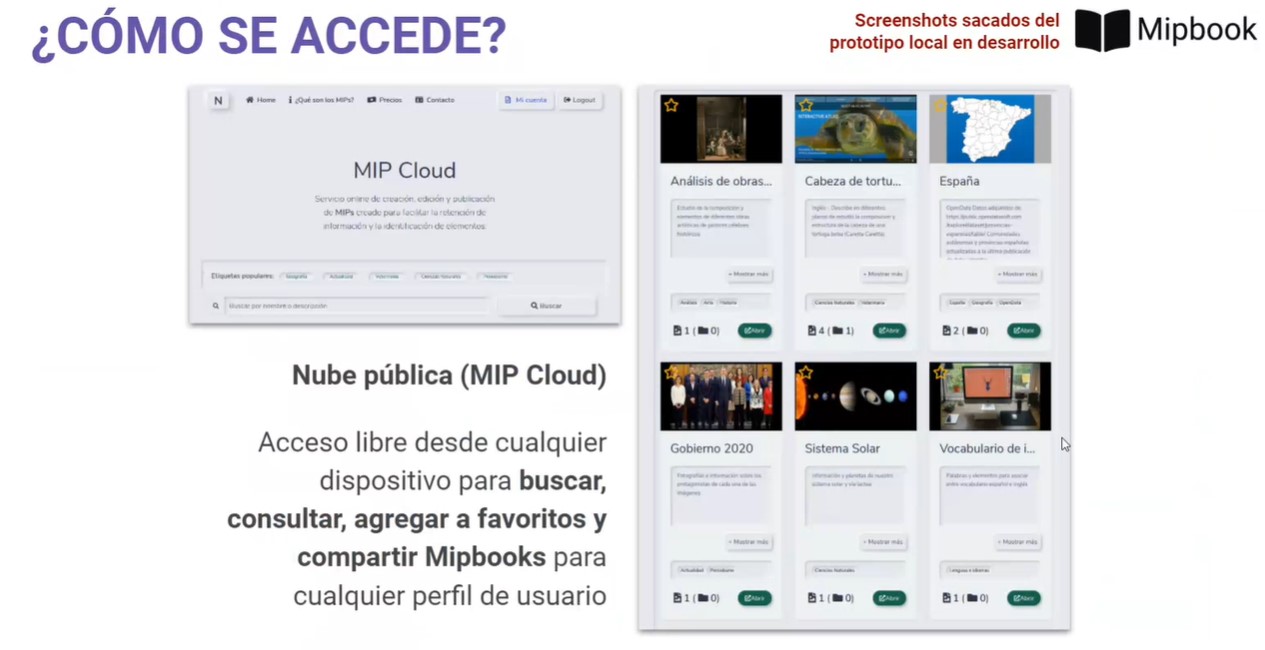
Third prize EducaWood
-
Team: Jimena Andrade, Guillermo Vega, Miguel Bote, Juan Ignacio Asensio, Irene Ruano, Felipe Bravo and Cristóbal Ordóñez.
EducaWood is a socio-semantic web portal that allows you to explore the forest information of an area of Spanish territory and enrich it with tree annotations. Its aim is to promote environmental learning activities, one of the main aspects of UNESCO's "Education for Sustainable Development Goals", which is part of the Spanish Government's Agenda 2030.
Thanks to the use of EducaWood, teachers can propose activities that students can carry out either face-to-face or online (through virtual field visits). In the face-to-face modality, students visit natural areas and make annotations of trees, such as location and identification of species, measurements, microhabitats, photos, etc. These annotations become available to the whole community as open data, thus enabling the application to be used remotely. These data are also enriched with other sources such as the Spanish Forest Map, the National Forest Inventory, GeoNames or DBPedia.
EducaWood helps students to learn more about their environment, while promoting ecological awareness.
Screenshots of Educawood
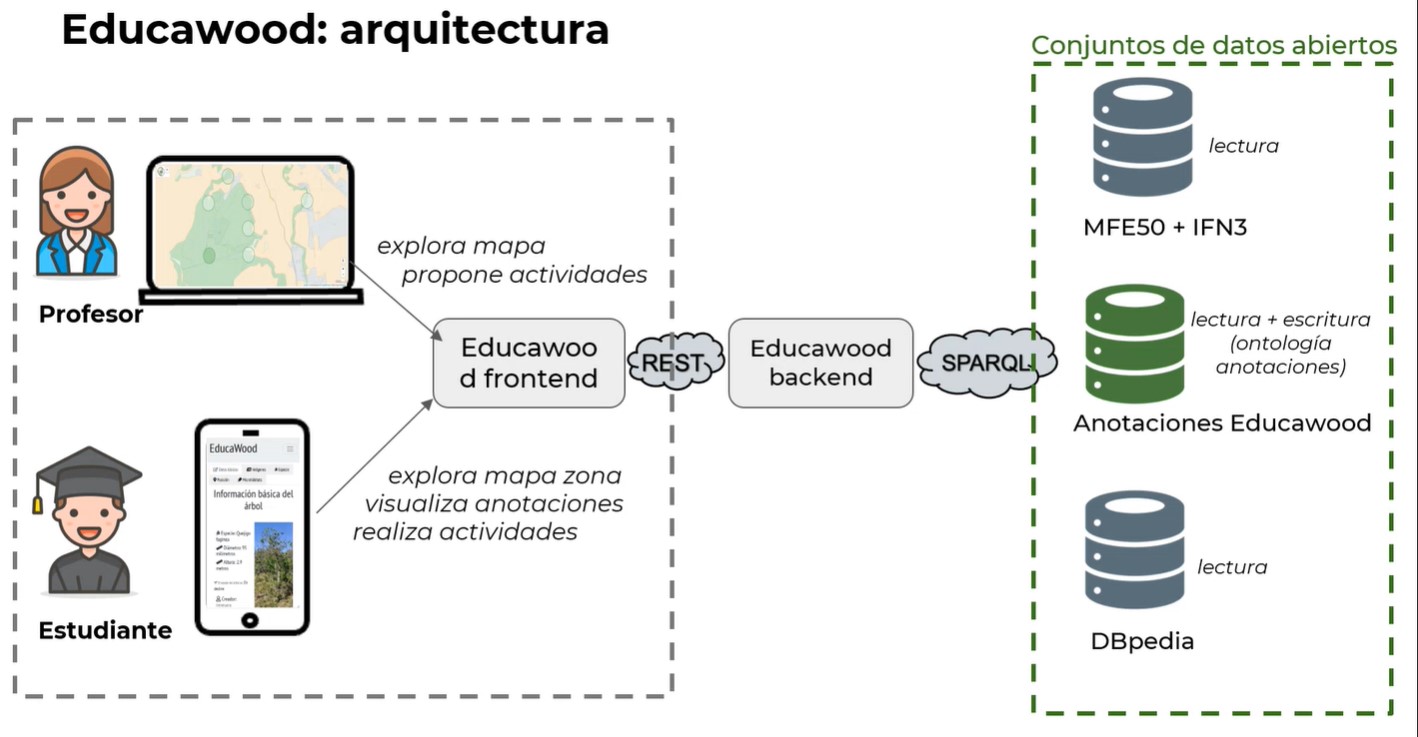
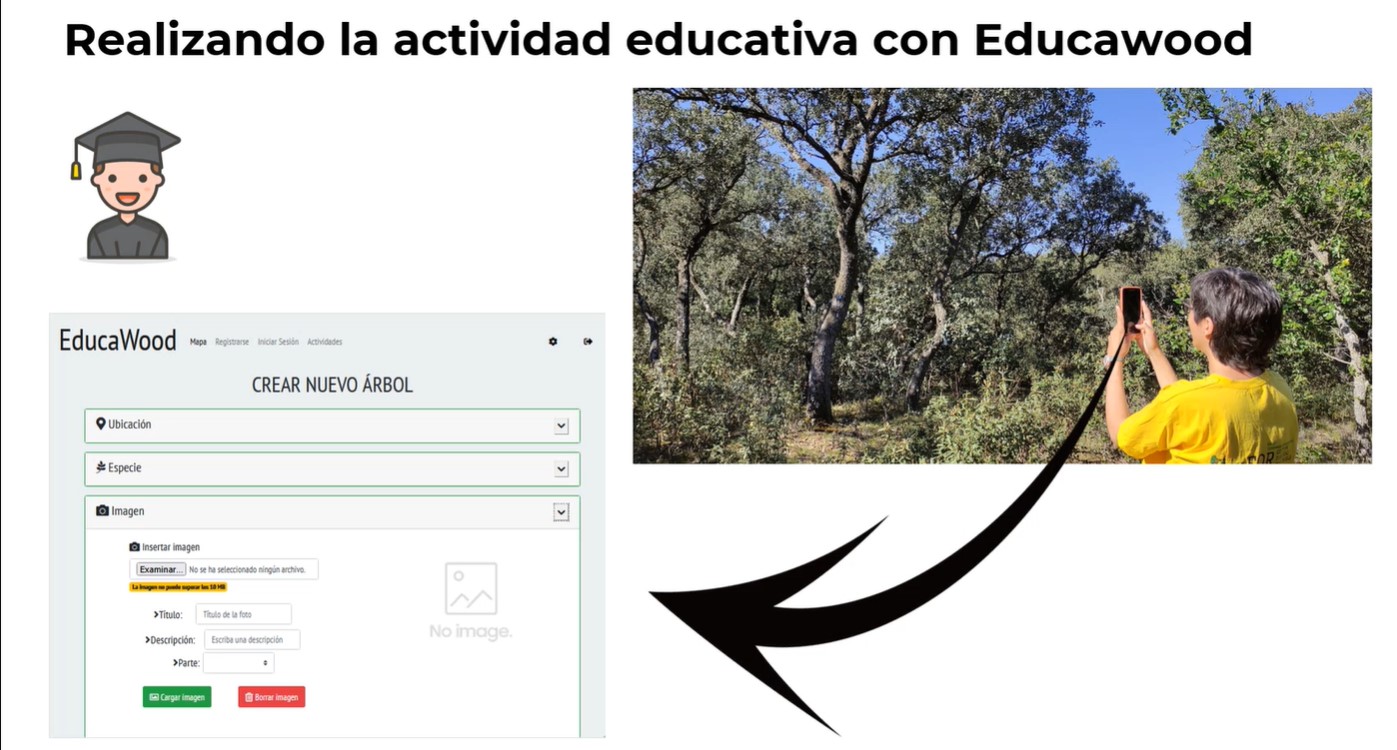
Alberto Martínez Lacambra, Director General of Red.es, presents the awards
The awards to the three winners were announced on 8 July at a ceremony held at Red.es headquarters.
The three awards were announced by Alberto Martínez Lacambra, Director General of Red.es, who highlighted education as a key element in the evolution of a society marked by the pandemic, as well as the need to work to reduce the digital and social divide that still exists. He thanked all the participants for their participation, highlighting the quality of their work.
The event was attended by several members of the jury, who were able to talk to the three winning teams.
In the following video you can see how the event took place. Photos are also available on our Flickr account.
At datos.gob.es we are already working to shape the IV Aporta Challenge, which we hope to announce in the coming months.