Noticia
Spring is coming to an end to give way to summer, holidays and warm weather. As with every change of season, for the Aporta Initiative it is time to review what has happened in the open data ecosystem over the last three months.
Boosting data strategies
During this season we have seen several initiatives, both local and statewide, launch processes to update their data strategies:
- In April, Málaga City Council presented a Municipal Open Government Plan that includes initiatives to promote open data. Specifically, the development of information campaigns, the homogenisation of dataset formats and the progressive incorporation of new datasets, also including data external to municipal management.
- The Community of Murcia launched a survey aimed at companies in the region to find out which datasets are of interest to them, with the aim of assessing their incorporation into the region's open data catalogue.
- The Government of Asturias carried out a participatory process to develop a Public Governance Strategy. Among other aspects, it aims to implement mechanisms to facilitate participation and access to open data.
- The Ministry of Economic Affairs and Digital Transformation has launched a consultation to identify proposals for the integration of Artificial Intelligence in the value chains of different sectors of the economy. All this within the framework of the National Artificial Intelligence Strategy.
The commitment to open data by Spanish public bodies is also evident in the growing support for the International Open Data Charter. Spanish representation in the Open Data Charter has grown this spring: two autonomous communities, Asturias and Valencia, and one local authority, the City Council of Pinto, agreed to join.
New portals and open datasets
In addition to the bloom, spring has also brought us new open data sharing platforms:
- Alcalá de Henares Town Council has developed a new Transparency and Open Data Portal to facilitate access to information and promote transparency in its management.
- A new version of Euskalmet, the meteorological service of the Basque Country, has also been launched. The portal includes an API Rest for reusers.
- The Spanish Patent and Trademark Office has presented a new version of its Open Data portal in a new format. Through it, users can access reusable data of all types of Industrial Property, available in PDF, XML or SGML formats, among others.
Other existing portals have opted to incorporate new tools:
- The Territorial Information Service of the Balearic Islands (Sitibsa) has launched a tool to automatically incorporate open data from its portal to the map service of the Spatial Data Infrastructure of the Balearic Islands (Ideib).
- The National Centre for Geographic Information (CNIG) has published the web application 'Mapa a la Carta', which allows to customise topographic maps.
- GeoPamplona, the geographic information system developed by the city council, has incorporated new features to improve the user experience and make the service more accessible to citizens. One example is its new catalogue of maps with information already selected, so that the user does not have to search for it.
- Zaragoza City Council has created 'Mis mapas, mis datos', a tool for creating simple and complex maps, combining various data sources.
Moreover, as usual, the vast majority of open data initiatives have been updating their data on a regular basis. Some of the new features that have been presented in recent months are the cultural heritage maps of each municipality on the Barcelona Provincial Council portal or the data on the state of the Mar Menor on the Murcia portal.
Events and training materials are growing
During these months we have attended many events and webinars related to open data. Some of them have been recorded and are available for viewing at any time:
- A few days before the arrival of spring, in March, there was the conference "Data in Local Administrations 20/30. Experiences and Challenges", organised by Alcobendas City Council, the Institute for Knowledge Transfer in Public Innovation (ITCIP) and the Innovation Club, with the support of the FEMP (Network of Local Entities for Transparency and Participation), the Spanish Network of Smart Cities - RECI and Oracle. The different sessions can be viewed here.
- On 23 April, a round table was held, within the framework of the Master in Technology and Digital Innovation in Engineering of the UNED, on "Big Data and datos abiertos applied to mobility". If you missed it, you can watch it on Youtube.
In addition, some courses, guides and books have been launched for those who want to broaden their knowledge of new technologies and data:
- The central government has launched the Elements of AI project in Spain. This is a free online course aimed at all citizens that offers training in the basic fundamentals of Artificial Intelligence.
- Castilla y León has presented the 'Digital transformation guide for public employees', which has a section dedicated to open data. It explains what open data is, talks about the National Open Data catalogue (datos.gob.es) and highlights the importance of reusing information in the public sector.
- The Geomatics and Surveying Engineering Forum of the IDEE Working Group publishes a new version of the book 'Spatial Data Infrastructures', which emphasises the publication and description of spatial datasets by means of services. Among other issues, it includes how they should be presented through viewers and catalogues for their management and exploitation.
Re-use of data by public administrations and citizens
The impact of open data has also become evident in recent months thanks to multiple examples. On the one hand, we have a number of public administrations that have taken advantage of the value of data to implement projects that improve their efficiency and the service they provide to citizens:
- The Madrid Tax Agency has launched a project to use Big Data and Artificial Intelligence to fight municipal tax fraud. A Tax Laboratory will lead this strategy by incorporating information from the City Council's Open Data Portal.
- The Provincial Council of Valencia starts the project 'Connecta València: tourist, intelligent and sustainable territory', which analyses tourist data to adapt and improve the experience in all its municipalities.
- Barcelona City Council has promoted the pilot project 'Dades x Comerç', developed by BCNOpenData to help small businesses make decisions and better understand customer behaviour based on open data.
On the other hand, companies and entrepreneurs have used data to create products, for example:
- The elections to the Community of Madrid left us with multiple examples of journalistic pieces developed based on open data, such as these from El Pais o eldiario.es.
- Two people from Bilbao have created CityAr, an app where users can organise routes, participate in events or play games through augmented reality. CityAr uses Bilbao's open data to show the city's cultural and leisure offer.
In this period, the call for two awards aimed at re-users has also been announced:
- The Asedie Awards 2021, for companies, institutions and open data projects that can contribute social and/or economic value. The deadline for applications is 15 September 2021.
- The new edition of the open data competition organised every year by Castilla y León, aimed at journalists, teachers, students or data reusers. Those interested in participating must send their proposal before 13 July.
A couple of global developments
At the international level, one of the main developments has been the launch of the new European data portal, data.europa.eu, which is positioned as a single access point for data from all over Europe. Its development and management for the next 6 years has been awarded to a consortium comprising, among others, the Ontological Engineering Group of the Polytechnic University of Madrid.
For its part, Asia has launched its first official portal that will bring together open data published by institutions, agencies and organisations from the different countries that make up the continent.
With these examples, it is clear that the open data ecosystem does not stop and continues to evolve month by month. If you want to share any other news that you consider of interest, we invite you to tell us your opinion in the comments section.
Blog
We recently reflected on the rise of data journalism in the media, a discipline that is becoming increasingly important. Through technologies and tools linked to data, this journalistic modality makes it possible to offer readers more documented, attractive and comprehensible information. To this end, data journalists perform actions such as interpreting municipal budgets, combining statistics and financial reports or exploring geospatial information to tell stories based on large amounts of data.
Here, we want to highlight the role that data journalism plays in serving as an impetus for the creation of new companies, associations and user groups that reuse data to boost the economy or drive accountability.
Next, we will analyse how the reuse of data, within the field of journalism, has favoured the emergence of new business models, non-profit organisations and transparency, research or political fact-checking activities in which data journalism is at the core of their business or daily activity.
Organisations involved in data journalism
News agencies: EPDATA
EpData is the platform created by Europa Press whose main objective is to facilitate the use of public data by journalists to enrich the news through graphics, as well as to analyse the context and contrast the figures offered by the different sources.
This platform was created with the aim of transferring the spirit of a news agency to the world of data journalism. To achieve this, they have created an extensive data repository with all the statistics that are often reported in Europa Press, with more than 60 million data from public and private sources. Any user can consult them through this link.
EpData's activities linked to data journalism
This repository allows EpData to offer graphs, statistics and data visualisations related to current events on a daily basis. For example, over the last year they have been showing updated data on the current pandemic that other media and scientific publications have used for their news.
However, the range of topics they combine on their platform is very broad, as they offer statistics and graphs based on data on topics as diverse as employment, economic developments, society, politics, etc.
Fact-checking: Maldito Dato
According to its coordinators, "Maldito Dato is the project within the verification media Maldita.es in which data journalism, transparency, investigation and political fact-checking, i.e. the verification of political discourse, are carried out".
In other words, Maldito Dato is the section of Maldita.es that carries out data journalism, made up of specialists in this field. Among its main functions is the production of journalistic pieces based on data, political fact-checking and topics based on the use of the Transparency Law.
Maldito Dato's activities linked to data journalism
Open data is an important part of Maldito Dato's nature, both in terms of publishing and reusing it in its news. Some examples are:
- Map of coronavirus cases at the municipal level throughout Spain, developed based on data published by each autonomous community.
- Ministry of Health data on vaccination, using data published by the Ministry of Health, either in the form of open data or daily reports.
- In this other example, you can see how they use data from the Statistical Portal of the Government Delegation against Gender Violence to make various comparative graphs on the increase in the number of calls to 016. They have also made comparative graphs based on INE data or even CIS data.
In addition to using open data from public administrations, sometimes they publish open data themselves. For example, when they release databases obtained by requests for information through the Transparency Law. Some examples are the database of public information requests made by citizens on the Transparency Portal, the database of health inspections of swimming pools in Madrid or the database of Ministry of the Interior subsidies for 'catastrophic situations'.
Non-profit organisation: CIVIO
CIVIO is a non-profit organisation that promotes the transparency of institutions and that people can access public information through technology combined with journalism. To achieve this goal, it has three main lines of action:
- Journalism
- Public Advocacy
- Transparency services of public authorities
CIVIO's activities linked to data journalism
This organisation has recently published research on the use of emergency procurement during 2020. They have used the emergency contracts awarded during the past year that have been published on the Public Sector Procurement Portal and the platforms linked to the different autonomous communities. A search engine for emergency contracts can be found at this link and the main conclusions of the research can be found here.
At the end of this article, CIVIO explains the methodology used to carry out the analysis of this data, as well as the difficulties encountered in the process. The data used in this research have been made available to all users in Datos Civio in formats that facilitate their reuse. Thanks to this, several media outlets have used the CIVIO database to produce their own information.
Data analysis, visualisation and communication: STORYDATA
Storydata is an organisation of women experts in data research, analysis, visualisation and communication. They are characterised by offering a global communication service aimed at public and private entities that want to transform a set of their own or external data into a communicative story. To do so, they use a variety of media and formats, from the preparation of reports to the creation of campaigns and the dissemination of content on social networks.
Storydata's activities linked to data journalism
Open data is part of Storydata's DNA. Some of its most relevant projects are:
- The Data against noise project, which aims to combat opinions on male violence through open data.
- Collaboration in the data section of the Barcelona Metròpolis magazine of Barcelona City Council.
- Writing of dissemination articles on data in the dossier of the Associació de dones periodistes de Catalunya (Association of Women Journalists of Catalonia).
- Collaboration agreement with Blanquerna's Master's Degree in Data Journalism and Fact Checking.
- Training to multiple media, institutions and universities on data journalism and visualisation, such as the Escola de dades de Sentit Crític, the Master of Information Design and Data Visualisation of Elisava, Euromediterranean Institute (Euromesco), Juries and training pill in the Big data Challenger of Fundación la Caixa.
Currently, Storydata collaborates with media such as Crític, for example, creating a data visualisation that shows inequality in times of confinement or this one on how the coronavirus affects the different municipalities of Catalonia.
User groups and list of data journalists
If you are a data journalist, or are interested in the subject, you may be interested to know that there are different platforms where you can find user groups related to the reuse of data in the field of journalism.
- On LinkedIn, the “Periodismo de datos” group stands out, created so that interested parties and professionals in data journalism can contribute and share knowledge related to this discipline.
- On MeetUp, we find the user group “Periodismo y visualización de datos”. Organised by Adolfo Antón, it has more than 1,200 participants who interact in relation to the use of data for its reuse in journalism.
- Also on MeetUp is the “Madrid Abriendo Datos” group.
- Telegram or Slack groups: many users organise through Telegram (in groups such as postdata, periodismodatos and visualizar) or Slack (periodismodatos.slack.com).
On the web we can also find a list of communicators specialised in data in Spain and Latin America, made up of more than 300 journalists. This project brings together a series of professionals who see data as the true raw material of journalism. If you want to consult the complete list, you can do so through the following link.
This is just a sample of organisations, companies and user groups linked to data journalism. If you know of any others that may be of interest, do not hesitate to write us a comment or send us an email to dinamizacion@datos.gob.es.
Content prepared by the datos.gob.es team.
Entrevista
Data journalism is one of the disciplines that has grown the most in the media in recent years, both within and outside our borders. This form of journalism consists of collecting accurate data, analysing it and making it available to the public through articles and/or graphic and interactive resources, facilitating the understanding of complex issues.
In datos.gob.es we have interviewed Adolfo Antón, designer, journalist, trainer and passionate about Free Software and open knowledge. Adolfo has been president of Open Knowledge Foundation Spain, coordinator of School of Data Spain, head of the Datalab at Medialab Prado, coordinator of the Data Journalism working group, of the Data Journalism Conference and curator of the Data Journalism (2014-2019) and Visualizar (2015-2018) workshops. He is currently coordinator of the Master's Degree in Journalism and Data Visualisation at the University of Alcalá and Professor of the Master's Degree in Digital and Data Journalism at the Nebrija University.
Full interview:
1. What does a data journalist do?
Thank you, first of all, for your interest in journalism and data visualisation and for what I can contribute to these fields. I appreciate and welcome the existence of datos.gob.es, an essential project that will soon be ten years old and which, paradoxically, I think is not sufficiently known, used and recognised in these fields.
To answer your first question, I am going to focus on what you have defined as data journalism, which begins with the collection of accurate data. There are currently many projects in the field of news verification and I see this, in my opinion, as a reaction to an exaggerated proliferation of false, manipulated news, hoaxes, lies and other faunas and floras of bad practices, not only journalistic but also communicative. The data we work with must be verified, certified, accredited and/or curated, providing context, source and methodology. Otherwise, we will develop flawed analysis and distorted stories.
There is a journalistic saying that goes "don't let a bad piece of information spoil a good headline", and in this temptation it is very important a strong journalistic ethics in journalists, editors and the media itself.
We need to verify, certify, accredit and/or curate the data we work with, providing context, source and methodology. Otherwise, we will develop flawed analyses and falsified stories.
Data journalism is essentially the use of computer applications to work with data, whether it is few, many or very many. Statistics, infographics and data visualisation are also important in data journalism.
With these IT tools, what Paul Bradshaw called the inverted pyramid of data journalism is realised:
- Compile (gather, collect).
- Cleaning (scrubbing, digging, investigating, interrogating)
- Contextualise (data and story context, methodology), and
- Combine (data, visualisations, infographics, maps, texts, interactives...).
It is therefore necessary to use IT tools and computer languages that cover one, several or all of the tasks in the work process. It is not mandatory, but it is advisable not to be cloistered in proprietary software, as this will determine the use we make of it. Third-party services can also be of great help, but it is preferable to use your own services that you have full control over
2. Why is data journalism important, and can you point us to any success stories or investigations where it has been key?
Data journalism is journalism that investigates with data and, therefore, is as important, necessary and primordial as journalism, if by this we mean critical and independent journalism, a fourth power in today's society. Not knowing how to work with data using IT tools limits us from doing good journalism, be it economic, political or sports journalism. Increasingly, data journalism is no longer the exceptional success story of generalist journalism, but the methodology of journalism in general.
The first cases of success in Spain can be circumscribed around Civio, an organisation that carries out data journalism in projects such as España en llamas, among others. Then, the projects that emerged around the conjunction of three elements that made data journalism grow in Spain are relevant:
- The Data Journalism group at Medialab-Prado, which awakens public interest in this discipline and enables the creation of an incipient community;
- The Unidad Editorial/URJC Master's Degree in Investigative Journalism, Data and Visualisation, which trains a first generation of data journalists;
- The media that are committed to it to a greater or lesser extent, such as El Español, El Mundo, El Confidencial, RTVE, El Diario de Navarra, eldiario.es or Ara.cat.
A high point in international data journalism, and also in Spain, was undoubtedly the investigation into the Panama Papers by the International Consortium of Investigative Journalists (ICIJ) in 2016, in which 109 media from 76 countries took part. In Spain, LaSexta and El Confidencial were the participating media and achieved a wide repercussion and the resignation of the Minister of Industry, Energy and Tourism.
Unfortunately, the Medialab-Prado Data Lab (the continuation of the data journalism group between 2016 and 2019) no longer exists, nor have all of these media maintained or strengthened their teams. But, in general, the discipline has spread in terms of community, universities and practices. This process has accelerated so much with the COVID crisis19, so that the current period is already considered the second golden age of data visualisation.
3. What challenges does data journalism face today?
It is a difficult question to answer because I believe that in addition to the traditional challenges of journalism, there are also those produced, as I said at the beginning, by the abundance of false, manipulated, biased news disseminated by social networks where issues such as ethics, privacy, authorship, anonymity or the automatic and mass-replicated production of content generates a deafening noise. In addition, intensive polarisation is used to collect data on people in order to create consumer profiles. This bombards the rational, reflective, discursive and greyscale process that good journalism can foster.
If I focus on data journalism as a methodology, the main challenge I see is to train journalists in the use of computer applications to work with data and thereby, little by little, improve journalistic output so that good data journalism products are valued by the general public.
The main challenge I see is to train journalists in the use of computer applications to work with data and thereby gradually improve journalistic output so that the general public appreciates good journalistic data products.
4. Is there a firm commitment by the traditional media to data journalism?
The Panama Papers were a hopeful moment for data journalism and also for the fact that a generalist television station was committed to this discipline. This has not happened in general terms, but it is true that the coronavirus crisis has produced an increase in work where some analysis and visualisation of data is produced, which can be seen on the front pages of media websites, for example. Without an in-depth analysis, I would say that most of them are more showcases with easy products than complete data journalism works in the sense that not all the stages of the journalistic project are carried out, but fragments that cover the demand.
It is worth highlighting the work in data analysis and visualisation being done by El País, RTVE.es and eldiario.es. At the same time, media specialised in news verification such as Newtral and Maldita are constantly producing news with innovative formats that also include data analysis and visualisation.
On the other hand, there are people who do not work in the media but who have come together since the beginning of the pandemic to work on COVID19 data in a commendable effort that combines data collection, analysis and visualisation and leaves the work practically ready for the media to take it and finish it off, but that magical connection has not yet been made.
From the experience of Medialab-Prado's data journalism workshops, I would say that working with data takes time, requires professionals, equipment, ideas, etc., but these are not investments that can be far from any newsroom, regardless of the size of the media outlet. The fact that such a firm commitment has not been made also leaves the field open for other proposals to position themselves better, as has happened with news verification.
5. Open data is essential for data journalists to have accurate information from official sources. What types of data are most in demand by data journalists for their research?
My impression is journalists do not normally take advantage of the open data that are available, either because it is very complex, because it requires extensive knowledge in data processing, because it requires a lot of work, because it is unknown or, finally, because it is not "attractive", it is not fashionable.
In other words, having an open data portal and an open data publication policy does not ensure that the data will be used, which does not mean that this, the publication of quality open data, should not be the default policy of any self-respecting public administration and source of information.
There are many different cases and to cite them all would take a more precise exercise of collecting them. Let us take two examples. INE data, in addition to their complexity, microdata, come in different formats. There are search engines with which to create your own set whose interfaces are very old and not very usable. Another case is the Zaragoza city council data portal. One of the best, but it requires registration to work with the API and the data can be extracted in JSON... I put an ellipsis because although it is one of the most used and manageable data formats, not everyone, as with microdata, knows how to use it. Ultimately, not all the problems in data journalism come from the absence of data but also from the formats and the skills to handle them.
Open data is often not exploited, either because it is too complex, because it requires extensive data processing skills, because it requires a lot of work, because it is unknown or, finally, because it is not "attractive", it is not fashionable.
In this sense, that of skills management, I remember that lately I have seen more than one media outlet embedding visualisations made by third parties. It could be one more example of those niches that data journalism is producing so that there are news agencies specialised in data. This should not be a negative thing, but it seems to me that third party tools are being used in limited formats. At the other extreme is the BBC, which makes a style guide on how to make graphics with R and creates a library so that the style of their graphics is different. That's betting on data too.
In the data journalism or visualisation workshops we always found that we lacked the magic dataset to work with, we had to create it. But we also encountered surprises and I think we certainly don't use most of the available data because we don't know it exists. So, in addition to demanding data, I would push in parallel for learning how to use existing data or create it.
6. How important are visualisations in data reporting? What technologies and tools do you use?
If I go by the usual story, visualisations are used in two main phases:
- On the one hand, at the data analysis stage. Data is visualised more easily with all kinds of graphical tools or charts that help us to find outliers, patterns, averages, etc.
- On the other hand, in the final part of the project, the journalistic product. The visualisation(s) can be just another part or the main piece of the journalistic story.
Lately I have been trying to explain what data visualisation is in computer terms. In paper format, visualisation is done with manual tools, manual or digital printing. But on the screen, on the Web, you can do any visualisation you want! With characters, text, images, video, audio, interaction, etc. If we understand the language and languages of this medium, we will be able to produce in a more integrated way data journalism works where any element has a place.
For this we do not need hardware other than what we already have, desktop or laptop computers, but we do need a compendium of free or open source software tools.
It goes without saying that there is a very wide spectrum of possibilities in the field of proprietary and/or proprietary software, but the use of free or open source software is essential to make a leap in the use of technologies in journalism and data visualisation.
If we understand the language and languages of this medium, we will be able to produce in a more integrated way data journalism works where any element has a place.
7. You are currently involved in 2 masters on data journalism, why should journalists have knowledge of data analysis and visualisation?
In addition to the Medialab-Prado experience, I have received or given courses in media and universities. I have been part of the Master in Data Journalism at Centro Universitario Villanueva in its three editions; I made the teaching guide for two modules of the Master in Data Journalism at UNIR and started teaching, although at that time I was not convinced by online training, possibly due to the use and abuse of proprietary software; I have taught a data module in the Master in Agency Journalism at Agencia EFE-UC3M. Now I am teaching in the Data Journalism and Visualisation module of the Master's in Digital and Data Journalism at Nebrija University where I try to transmit this basic knowledge about journalism and data visualisation.
I never stop learning and practising every day. I have created this Master's Degree in Journalism and Data Visualisation at the University of Alcalá because I understand that there is no training programme that addresses these issues in a comprehensive way, from free or open source software, and because since I started to relate to this world I have seen that data analysis and visualisation are essential for data journalism, but they have not been addressed in this way in the different university programmes.
It is true that, from the beginning, I have also heard or read that data journalism is collaboration and that there are many profiles in the newsroom and one person can't have them all, and the virtue is cooperation. That is true, but in order to cooperate you have to know how to cooperate on the one hand and know what you want to cooperate about on the other. In classical journalism, cooperation is commonplace - let's hope it is not lost - so all that is missing is the skills. The training that is done, almost always, tends to cater for different profiles, so that you also need to have an overview, to know what others do, what things might interest me, what strengths I should develop or compensate for. And then, having a good base and with practice, to use one or other skills in one or other roles.
Entrevista
R Hispano is a community of users and developers that was born in 2011, within the III Conference of R Users, with the aim of promoting the advancement of knowledge and the use of the programming language in R. From datos.gob.es we have spoken with them so that they can tell us more about the activities they carry out and the role of open data in them.
Full interview.
1. Can you briefly explain what the R-Hispano Community is?
It is an association created in Spain whose objective is to promote the use of R among a Hispanic audience. There are many R users worldwide and we try to serve as a meeting point for all those whose primary language is Spanish. By having a smaller group within such a large community as a reference, it is easier to build relationships and meet people to turn to when you want to learn more or share what you have learned.
2. R was born as a language linked to the statistical exploitation of data, however, it has become an essential tool of Data Science, why so much acceptance of this language by the community?
It's true that many data science and engineering professionals tend to use more generic languages like Python. However, there are several reasons why R is essential in the "Stack" of teams that work with data. First of all, R has its origin in the S language, which was designed in the 1970s specifically for data analysis, within the Bell Laboratories. This allows people with different computer backgrounds to participate in complex projects, focusing on analysis methods. Second, R has aged very well, and a broad community of users, developers, and businesses contribute to the project with packages and tools that quickly extend functionality to the most innovative methods with (relative) simplicity and rigor.
3. R Hispano works through numerous local initiatives, what advantages does this form of organization bring?
In day-to-day activities, especially when we had face-to-face meetings, more than a year ago, it is more comfortable to coordinate people as closely as possible. It makes no sense for a person in Madrid to organize monthly meetings in Malaga, Seville or the Canary Islands. The interesting thing about these events is to attend regularly, get to know the attendees, understand what the public demands and what can be offered. That, apart from pampering and dedication, requires being close because, otherwise, there is no way to establish that bond. That is why it seemed to us that it is from the cities themselves that this relationship has to be maintained from day to day. On the other hand, it is the way in which the Community of R has been organized around the world, with the success that we all know.
4. Do you consider open data initiatives a valuable source of information for the development of your projects? Any notable reuse examples? What aspects of the current initiatives do you consider could be improved?
The first thing to say is that R Hispano as such has no projects. However, many R Hispano partners work with open data in their professional field, be it academic or business. Of course, it is a very valuable source of information, with many examples, such as the analysis of data from the pandemic that we still suffer, data from sports competitions and athletes' performance, environmental, socio-economic data, ... We cannot highlight any of them because there are many very interesting that would deserve it equally. As for the improvements, there are still many public data repositories that do not publish it in a “treatable” format by analysts. A PDF report can be open data, but it certainly does not contribute to its dissemination, analysis, and exploitation for the good of society.
5. Can you tell us about some of the activities carried out by these local Initiatives?
Several local R groups, both in Spain and Latam, recently collaborated with the technology training company, UTad, in the event “Encounters in the R phase”. Held online for two days. The R user days that we celebrate each year are usually organized by one of the local groups at the headquarters. The Córdoba group is organizing the next ones, postponed due to the pandemic and for which we hope to announce dates soon.
The Madrid R User Group began to function as a local group linked to the Hispanic R Community more than fifteen years ago. Since its origin, it has maintained a monthly periodicity of meetings announced on the social network Meetup (sponsored by RConsortium, entity, founded and subsidized by large companies to favor the use of R). The activity has been interrupted by the limitations of the Covid-19, but all the history of the presentations has been compiled in this portal.
From the Group of R Canarias they have been involved in the conference TabularConf, which took place on January 30, online, with an agenda of a dozen presentations on data science and artificial intelligence. In the past the Canarian group carried out a R user meeting with communications on various topics, including modeling, geographic data processing, as well as queries to public data APIs, such as datos.gob.es, with the library opendataes. Other bookstores presented at a meetup they held in 2020 areistacr or inebaseR, always betting on access to public data.
In the Local Group of Seville, during the hackathons held in recent years they have begun to develop several packages totally linked to open data.
- Air: To get air quality data in Andalusia (works, but needs some adjustments)
- Aemet: R package to interact with the AEMET API (climatic data). We took the first steps in a hackathon, then Manuel Pizarro made a fully functional package.
- Andaclima: Package to obtain climatic data from agroclimatic stations of the Junta de Andalucía
- Data.gob.es.r: Package embryo to interact with http://datos.gob.es. Really just an exploration of ideas, nothing functional for now.
Regarding COVID-19, it is worth highlighting the development by the UCLM, with the collaboration of a former member of the Board of Directors of the R Hispano Community, of this COVID-19 analysis panel, with the cases that the Board of Communities of Castilla-La Mancha presented by municipality. It consists of a interactive tool to consult the information on the incidence and rates per 100,000 inhabitants.
6. In addition, they also collaborate with other groups and initiatives.
Yes, we collaborate with other groups and initiatives focused on data, such as the UNED (Faculty of Sciences), which for a long period of time welcomed us as its permanent headquarters. I would also highlight our performances with:
- Data Journalism Group. Joint filings with the Data Journalism group, sharing the benefits of R for their analysis.
- A collaboration with the Group Machine Learning Spain that resulted in a common presentation in the Google Campus of Madrid.
- With groups of other data languages, such as Python.
- Collaborations with companies. At this point we highlight having participated in two Advanced Analytics events organized by Microsoft, as well as having received small financial aid from companies such as Kabel or Kernel Analytics (recently acquired by Boston Consulting Group).
These are some examples of presentations in the Madrid group based on open data:
-
Madrid Air Quality Analysis (First Y Second version)
- ENRON data analysis
In addition, different partners of R-Hispano also collaborate with academic institutions, in which they teach different courses related to Data analysis, especially promoting the use and analysis of open data, such as the Faculty of Economics of the UNED, the Faculties of Statistics and Tourism and Commerce of the UCM, the University of Castilla-La Mancha, the EOI (specific subject on open data), the Francisco de Vitoria University, the Higher School of Telecommunications Engineering, the ESIC and the K- School.
Finally, we would like to highlight the constant link that is maintained with different relevant entities of the R ecosystem: with R-Consortium (https://www.r-consortium.org/) and RStudio (https://rstudio.com/). It is through the R-Consortium where we have obtained the recognition of the Madrid Group as a stable group and from which we obtain the sponsorship for the payment of Meetup. Within RStudio we maintain different contacts that have also allowed us to obtain sponsorships that have helped in the R Conference, as well as speakers of the stature of Javier Luraschi (author of the package and book on “sparklyr”) or Max Kuhn (author of packages such as "Caret" and its evolution "tidymodels").
7. Through ROpenSpain, some RHispano partners have collaborated in the creation of packages in R that facilitate the use of open data.
ROpenSpain is a community of R, open data and reproducibility enthusiasts who come together and organize to create R packages of the highest quality for the exploitation of Spanish data of general interest. It was born, with the inspiration of ROpenSci, in February 2018 as an organization ofGitHub and has a collaboration channel in Slack. As of January 2021, ROpenSpain groups the following R packages:
- opendataes: Easily interact with the data.gob.es API, which provides data from public administrations throughout Spain.
- MicroData: Allows importing to R various types of INE microdata files: EPA, Census, etc.
- caRtocity: Consult the Cartociudad API, which provides geolocation services, routes, maps, etc.
- Siane: To represent statistical information on the maps of the National Geographic Institute.
- airquality: Air quality data in Spain from 2011 to 2018.
- mapSpain: To load maps of municipalities, provinces and Autonomous Communities. Includes a plugin for leaflet.
- MorbiditySpainR: Read and manipulate data from the Hospital Morbidity Survey
- spanish: For the processing of certain types of Spanish information: numbers, cadastral geocoding, etc.
- BOE: For the processing of the Official State Gazette and the Official Gazette of the Mercantile Registry.
- istacbaser: To consult the API of the Canary Institute of Statistics.
- Cadastre: Consult the Land Registry API.
Some of these packages have been featured at events organized by the R Hispano Community.
8. Finally, how can interested people follow R-Hispano and collaborate with you?
An important element as a link in the entire community of R users in Spanish is the R-Help-es help list:
- Search: https://r-help-es.r-project.narkive.com/;
- Subscription: https://stat.ethz.ch/mailman/listinfo/r-help-es ).
It is one of the few active R-Help lists independent of the main English R-Help that has generated more than 12,800 entries in its more than 12-year history.
In addition, a high level of activity is maintained in social networks that serve as a speaker, a lever through which future events or different news related to data of interest to the community are announced.
We can highlight the following initiatives in each of the platforms:
- Twitter: Presence of the R-Hispano association itself; https://twitter.com/R_Hisp and participation in the hashtag #rstatsES (R in Spanish) of different R collaborators at the national level.
- LinkedIn: In this professional network, "R" has a presence through the company page https://www.linkedin.com/company/comunidad-r-hispano/. In addition, many R-Hispano partners from both Spain and Latam are part of this network, sharing open resources.
- Telegram channel: (https://t.me/rhispano) There is a telegram channel where news of interest to the community is disseminated with certain periodicity
Finally, on the association's website, http://r-es.org, you can find information about the association, as well as how to become a member (the fee is, like R, free)
Noticia
The European Data Portal (EDP) has presented its report "Copernicus data for the open data community", prepared by con.terra as part of the EDP consortium. As we have reported before, Copernicus is the European Union's Earth Observation program that provides accurate, timely and easily accessible information to improve environmental management, understand and mitigate the effects of climate change and ensure civil security.
The report aims to help users harness the potential of Copernicus data to create Earth observation applications by answering three basic questions:
- What can I do with Copernicus data?
- How can I access the data?
- What tools do I need to use the data?
After an introduction reviewing the main activities and services available from the program, the report is divided into two parts: a first part where examples of Copernicus data applications are examined and a second, more practical part, where a particular use case is replicated in depth.
Copernicus use cases
The first part covers a series of possible use cases at a general level to answer the first of the questions posed above: what can be done with Copernicus data?
The use cases discussed are linked to the thematic areas addressed by the Copernicus program (emergency, security, marine, land, climate change and atmospheric monitoring), as well as to its services and tools. These examples cover the observation of plastic pollution of the oceans, land change due to mining activities, the impact of volcanic activities, ice loss, the creation of artificial islands, deforestation, forest fires, storms or pests.

The report highlights the importance of knowing what data are appropriate for each specific use case. For example, SENTINEL 2 MSI data is suitable for land monitoring, emergency management and security services, while SENTINEL 3 Altimetry data is linked to the areas of marine monitoring and climate change. To assist in this identification task, the guide includes references to various user guides with specifications on the missions, the instruments used to collect the data and the data products generated.
Case study on the use of Copernicus data
The second part of the report focuses on a particular use case that it addresses in depth, including how to download the appropriate data, process it and build applications with it. Specifically, it addresses the mapping of the lava flow of the Etna volcano using data from the Copernicus emergency management service. The aim is to track the impact of volcanic activities on nature and urban areas.
First, the report shows how to search and download data for this area of interest. In this case, Sentinel-2 products are used from the Copernicus Open Access Hub. The entry point for accessing the Copernicus data is their own website, which provides an overview of the data access points. Through different images, the report shows search and filter options to locate the appropriate data.

To visualize and process the data, it is proposed to use commercial software such as ArcGIS Pro, free GIS tools such as QGIS, open source processing tools such as SNAP or programming libraries such as GDAL. In the case of the example, SNAP (Sentinel Application Platform), the European Space Agency (ESA) platform, is used to view the lava flow.
Some explanations on workflow automation with the Open Access Hub API and the SNAPgraph tool are given at the end of the chapter.
Final conclusions
The report ends with several conclusions, among which the following stand out:
- Users can extract great value from Copernicus data but to do so they need to be familiar with the platforms involved and the necessary tools.
- For most use cases, it is necessary to combine Copernicus data with in situ data. The Copernicus program itself uses data from ground-based sensors, for example, for calibration and validation of its products.
Spain's role in Copernicus
The Ministry of Transport, Mobility and Urban Agenda, through the National Geographic Institute, and the Ministry for Ecological Transition (MITECO) represent Spain in the Copernicus User Forum, for the monitoring and evolution of the program. In this interview Nuria Valcárcel, Deputy Assistant Director (Observation of the Territory) of the General Directorate of Geodesy and Cartography, in the D.G. National Geographic Institute (IGN) delves into the services of Copernicus and its usefulness in the economic and social field.
In datos.gob.es you can also find this other interview with Stéphane Ourevitch, founder of SpaceTec, who participated as a speaker at the Encuentro Aporta 2019, where he tells us about the usefulness of data for space observation and how the Copernicus program promotes entrepreneurship through actions such as hackathons.
Copernicus data are very useful all over the world. In our country, we also find multiple services and applications developed based on Copernicus data, some of which are collected in this article.
Noticia
Open Data Day was the date chosen for the launch of the EU Datathon 2021, an event that is now in its fifth edition. Organized by the Publications Office of the European Union within the framework of the EU Open Data Days, seeks to highlight the value of open data and show the opportunities of business models based on it.
Participating teams must create a mobile or web application that responds to challenges related to the priorities of the European Commission, using open data sets.
3 challenges to solve
The available challenges are:
- Challenge 1: ‘A European Green Deal’. The European Green Deal it is the blueprint to drive a modern, sustainable and competitive European economy. Those who choose this challenge will need to develop applications or services aimed at creating a greener Europe, for example by promoting efficient use of resources or reducing pollution.
- Challenge 2: ‘An economy that works for people’. In this case, applications or services aimed at companies, public administrations or citizens in general are sought in order to create a fairer economic and monetary union, which allows the growth of the economies of the member countries together with the reduction of poverty and inequality. This category would include, for example, a solution to boost youth job creation.
- Challenge 3: ‘A Europe fit for the digital age’. The EU aspires to a digital transformation that works for people and businesses. Therefore, this challenge encourages the creation of applications or services that improve data competencies, increase connectivity or make data more understandable for everyone, based on the European Data Strategy.
Each challenge is organized as a separate competition of equal importance.
The solutions presented must combine at least one data set of data.europa.eu (EU Open Data Portal o European Data Portal) with any other publicly available data set.
Who can participate?
It is aimed at citizens around the world who are interested in prototyping products based on public open data and even creating new business models for profit or not for profit through the exploration of such data.
Participation is open to individuals or legal entities, integrated in teams of between one and four members.
Staff working in the institutions, agencies, bodies, partner organizations or contractors of the EU Publications Office cannot register.
How does the competition develop?
Los equipos participantes deben registrar su propuesta siguiendo este formulario antes del 21 de mayo de 2021 a las 23:59 CET (hora central europea). A partir de entonces la competición se desarrollará en 2 fase:
-
Preselection
All proposals will be evaluated by the jury, made up of experts from within and outside the EU institutions and agencies based on a series of criteria such as the relevance of the selected challenge or the potential and creativity of the proposed solution.
For each challenge, a maximum of three teams that have obtained the highest number of points will be shortlisted. All participating teams will receive notification of the results before June 11, 2021.
-
Final phase
Shortlisted teams (three per challenge) will be invited to convert their proposals into applications. In addition, each shortlisted team must produce a 60-second video, in which they present their application and the team working on it, before August 1, 2021.
The final of the competition will take place on November 25. The applications presented in each challenge will be evaluated by a jury made up of at least five experts. In addition to the relevance of the proposal, the open data used (economic and social potential, interoperability with other data sources, etc.) and the adequacy of the objective (product maturity, benefits offered, etc.) will be taken into account.

Which is the prize?
In total, 99,000 euros will be awarded (33,000 for each challenge), which will be divided for each challenge as follows:
- First place: 18,000 euros
- Second place: 10,000 euros
- Third place: 5,000 euros
From datos.gob.es we invite you to submit your proposal. Good luck to all participants!
Blog
More than 2.5 billion tonnes. That is the amount of waste that, according to the European Union, is produced every year in the EU - although the specific figure is from 2016 -, with the consequent danger to the environment and our own future. This worrying situation is leading the European institutions to promote a change of model in waste management.
For years, waste management has been linear, i.e. natural resources are extracted, used to produce a certain good, consumed and then discarded. This system requires large amounts of energy and cheap, easily accessible materials. Part of this model are also practices such as programmed obsolescence, very common in the technological field, where the company "programs" the end of the useful life of the product, in such a way that after a certain period of time it stops working.
This linear model is not viable in the long term, which is why more and more people are calling for a change to a management based on the circular economy.
What is the circular economy?
Circular economy refers to an economic system that replaces the concept of 'end-of-life' with 'reduce, reuse, recycle and recover materials in the production, distribution and consumption processes'. In other words, instead of discarding products, they re-enter the production cycle, which contributes to creating environmental quality, economic prosperity and social equity for the benefit of current and future generations.
Through these actions, we can maximise the life cycle of products and minimise waste. When a product ceases to function, its materials can still be used to create new products and remain in the economy wherever possible.
There are many benefits to this practice, from reduced greenhouse gas emissions to financial savings for businesses and consumers, who can benefit from longer-lasting products.
How does open data contribute to fostering the circular economy?
As in other fields, information obtained through open data can help drive better decision-making on the efficient use of resources. Data can help train algorithms to predict certain trends and help citizens, administrations and businesses to implement the necessary measures to ensure a sustainable future.
In its article ‘Open Data and the Circular Economy’, the European Data Portal details 3 areas where open data has a major impact on the circular economy:
- A more sustainable food system. Open data can help solve logistical problems, improve efficiency and ensure food security. Data on production and distribution, temperature changes of products, rising water levels or mapping of deforestation can improve strategic decision-making to regulate supply and demand across Europe, avoiding over-consumption of resources. In this regard, an example is Smartchain's open data-based research, which aims to develop a shorter and more sustainable food supply chain.
- Efficient resource management and waste optimisation. The selective collection process and the use of the total capacity of recycling plants can be improved with the right information. In this regard, Santiago City Council has implemented a smart municipal solid waste collection system using IoT technology and machine learning algorithms enriched with open data. In this area, citizen awareness is also fundamental through apps such as EcoCity, which monitors waste management in cities and sets a series of targets to improve urban recycling habits and reduce waste generation. Users can choose the recycling bin they want to monitor in their neighbourhood. If they detect any incidents with the registered bins, they can send a warning directly to the local council.
- Pollution reduction. Open data on contamination of the air or our seas helps to raise awareness of pollution and its health risks. This type of information can improve the decision-making process to protect the health of EU citizens and the environment through preventive measures, such as halting the expansion of London Heathrow Airport. Applications and visualisations such as the National Air Index, Aire.cat or this freshwater ecosystem explorer show indicators that raise awareness of the reality of our environment.
How Europe's circular economy is progressing
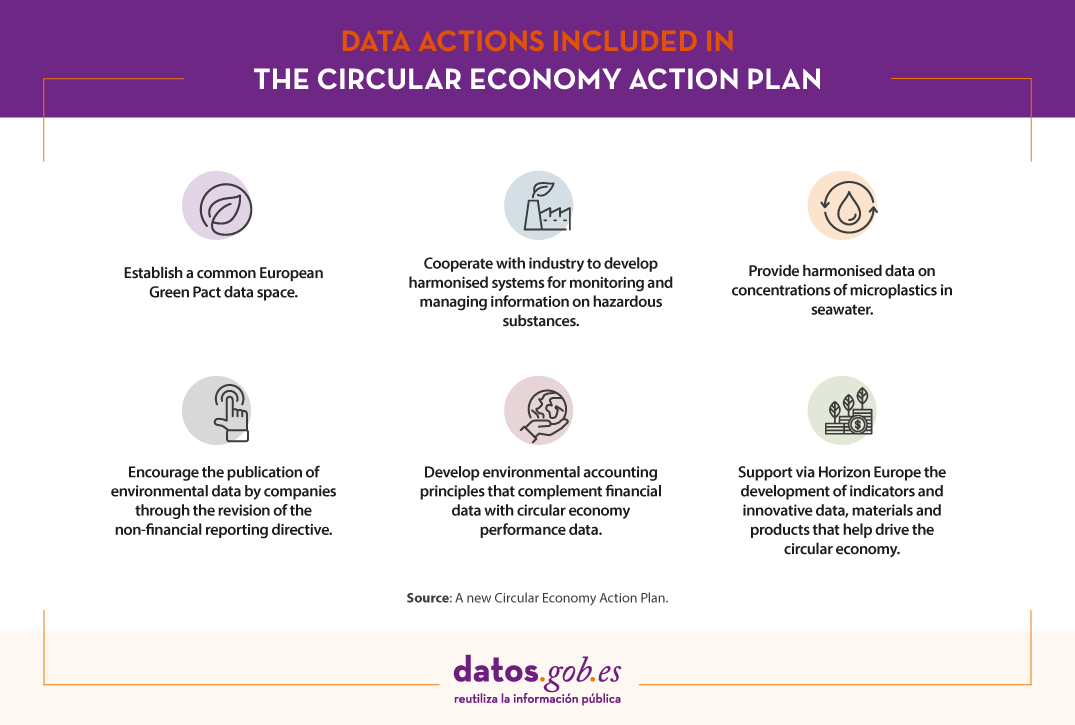
The European Commission presented last March 2020, in the framework of the European Green Pact, a new Circular Economy Action Plan which includes proposals on designing more sustainable products, reducing waste and empowering citizens (such as the "right to repair").
In addition, in order to effectively and efficiently implement the new sustainable products framework, the Commission is pursuing a number of data actions such as:
- Establish a common European Green Pact data space for smart applications with data on value chains and product information.
- Provide harmonised data on concentrations of microplastics in seawater.
- Cooperate with industry to develop harmonised systems for monitoring and managing information on hazardous substances, in synergy with measures under the sustainable product policy framework and the European Chemicals Agency (ECHA).
- Encourage the publication of environmental data by companies through the revision of the non-financial reporting directive.
- Support a business initiative to develop environmental accounting principles that complement financial data with circular economy performance data.
- In addition, Horizon Europe will support the development of indicators and innovative data, materials and products that help drive the circular economy.
In our country, the promotion of the circular economy is marked by the Spanish Circular Economy Strategy 2030 (EEEC), whose objectives for 2030 include reducing waste generation by 15% compared to 2010, improving water use efficiency by 10% and reducing greenhouse gas emissions to below 10 million tonnes of CO2 equivalent.
We live in a context of increasing demand for raw materials and scarcity of resources. Many raw materials are finite and, as the world's population increases, so does demand. The circular economy is therefore a key element for the optimal development of the future of the entire population. Within all the initiatives that are already underway, data can play a key role in increasing our knowledge and driving technologies that help all citizens to move towards a sustainable future.
Content prepared by the datos.gob.es team.
Noticia
The open data ecosystem has been very active over the last few months. The year 2020 has ended with two important developments. The first, the Open Data Maturity Report published by the European Data Portal, where Spain has increased its overall position by 5% and remains among the leaders in the European sector. The second is the new National Strategy for Artificial Intelligence, which includes a series of actions related to open data.
But there are many more new developments that have taken place in recent months. In this article we tell you about some examples, both at national, local and regional level.
State initiatives related to open data
In addition to the publication of the Artificial Intelligence Strategy, in recent weeks the Plan for the Digitalization of Public Administrations 2021-2025 has also been presented, which will mobilize public investment of at least 2,600 million euros over the next three years. Among its points, the plan highlights "the importance of evolving the model of access to public and private information to promote high value-added services". To this end, it will build on the work carried out by the Aporta Initiative in the field of open data.
In addition to these strategic actions, it should be noted that some state agencies have taken advantage of the winter season to launch new projects linked to open data:
- The Ministry of Transport, Mobility and Urban Agenda has published its mobility study with Big Data that characterizes mobility at national, autonomous community, provincial and local levels during the COVID-19 pandemic. The data generated in the study has been made available to citizens in open data format and has been used to develop a series of indicators.
- The Ministry of Tourism has launched 'Dataestur', a platform that collects basic data on tourism in Spain and from which you can access the various sources of tourism statistics from public and private organizations.
Local open data initiatives
During these last months, several municipalities and institutions have carried out initiatives related to open data, such as:
- The open data portal of the Government of Aragon launched a new chatbot service that makes it easier for citizens to access the information available in Aragon Open Data. Thanks to this, Aragonese people can be better informed and make use of the data in a more accessible way.
- The Community of Murcia creates 'Education in Open Government', a new educational program to bring concepts such as accountability and citizen participation closer to students.
- The City Council of Santiago de Compostela has developed and built new smart surface collectors for the characterization of organic solid waste, through the use of IoT technologies and algorithms trained with open data. This action allows it to advance on its path towards becoming a smart city.
- The Government of the Canary Islands launched its new open data portal, which has more than 7,500 data. Thanks to this, this portal has managed to become the single access point with the most public information data registered in all of Spain.
- The Community of Madrid has announced a new open data strategy to promote and strengthen the transparency of the administration and promote economic development based on knowledge, information and data.
- The Ronda City Council launches "Geoportal Ronda" a new spatial open data tool through which you can now consult all the geographic and urban information of the municipality.
- The City Council of Malaga has received recognition at the IDC Awards thanks to a municipal project that values open data and its uses to improve the quality of life of citizens. Specifically, the Consistory has been third in the category of 'Economic development and citizen engagement'.
- The Vigo City Council has also been awarded in the category 'Planning and administration' thanks to the Smart City VCI+ platform, which centralizes and structures the city's data to create a scorecard that allows a more efficient local management. The platform includes an open data portal so that citizens can consult municipal data in different formats and use them in professional and private environments.
International developments
Acabamos el repaso incluyendo algunos ejemplos de proyectos internacionales ligados con la materia:
We finish the review by including some examples of international projects related to the subject:
- The European Union is driving the EO4AGRI project, which seeks to use earth observation data from the Copernicus program to digitize the agricultural sector and adapt the CAP to the new times.
- The European Commission has launched a public consultation to gather feedback on public sector interoperability initiatives in the EU. The information gathered will feed into the evaluation of the European Interoperability Framework (EIF). The deadline for participation is April 27.
- An international expedition has created a dataset that collects information on the physical and biological dynamics of the Arctic to help better understand climate change. For the time being, this data will be used exclusively until January 1, 2023, when it will be published openly.
- China has unveiled a public data platform that makes it possible to check emission levels in real time to see which factories and institutions pollute the most.
- Argentina's Ministry of Tourism and Sports has launched an open data portal using Andino, a platform on top of CKAN.
These are just a few examples that can be found in the world of open data, but there are many more. If you know of any other interesting new developments that are of interest, you can mention them in the comments or send us an email to dinamización@datos.gob.es.
Noticia
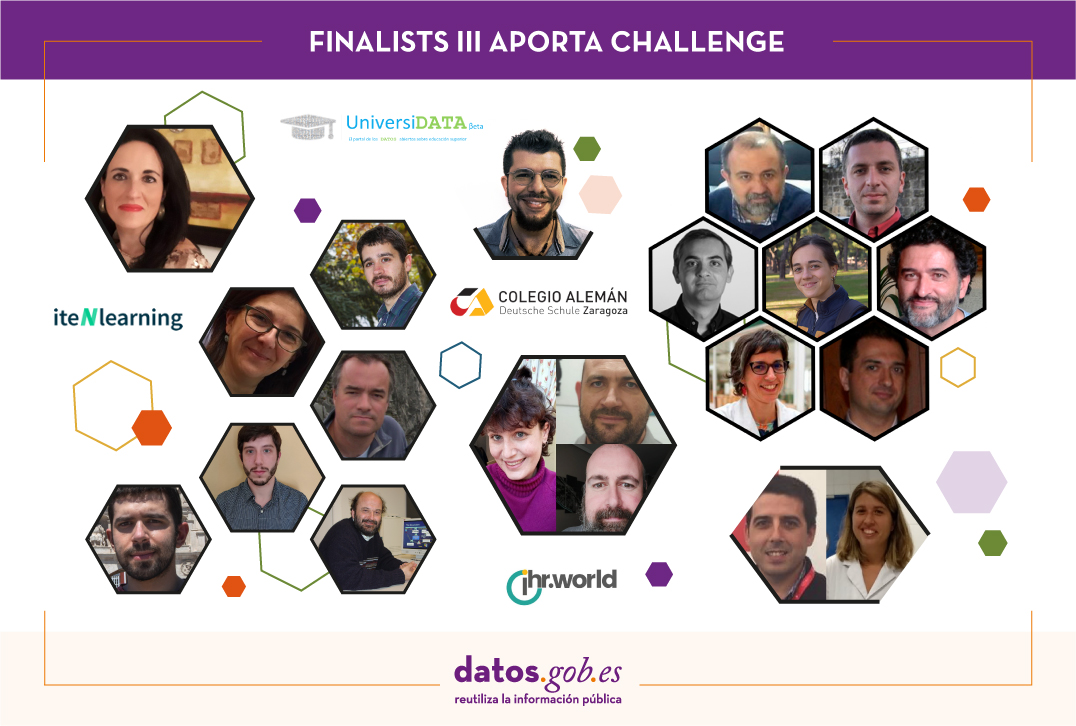
Last October, the Aporta Initiative, together with the Secretary of State for Digitalization and Artificial Intelligence and Red.es, launched the third edition of the Aporta Challenge. Under the slogan "The value of data in digital education", the aim was to reward ideas and prototypes capable of identifying new opportunities to capture, analyse and use data intelligence in the development of solutions in the field of education.
Among the proposals submitted in Phase I, there were a wide range of entries. From individuals to university academic teams, educational institutions and private companies, which have devised web platforms, mobile applications and interactive solutions with data analytics and machine learning techniques as protagonists.
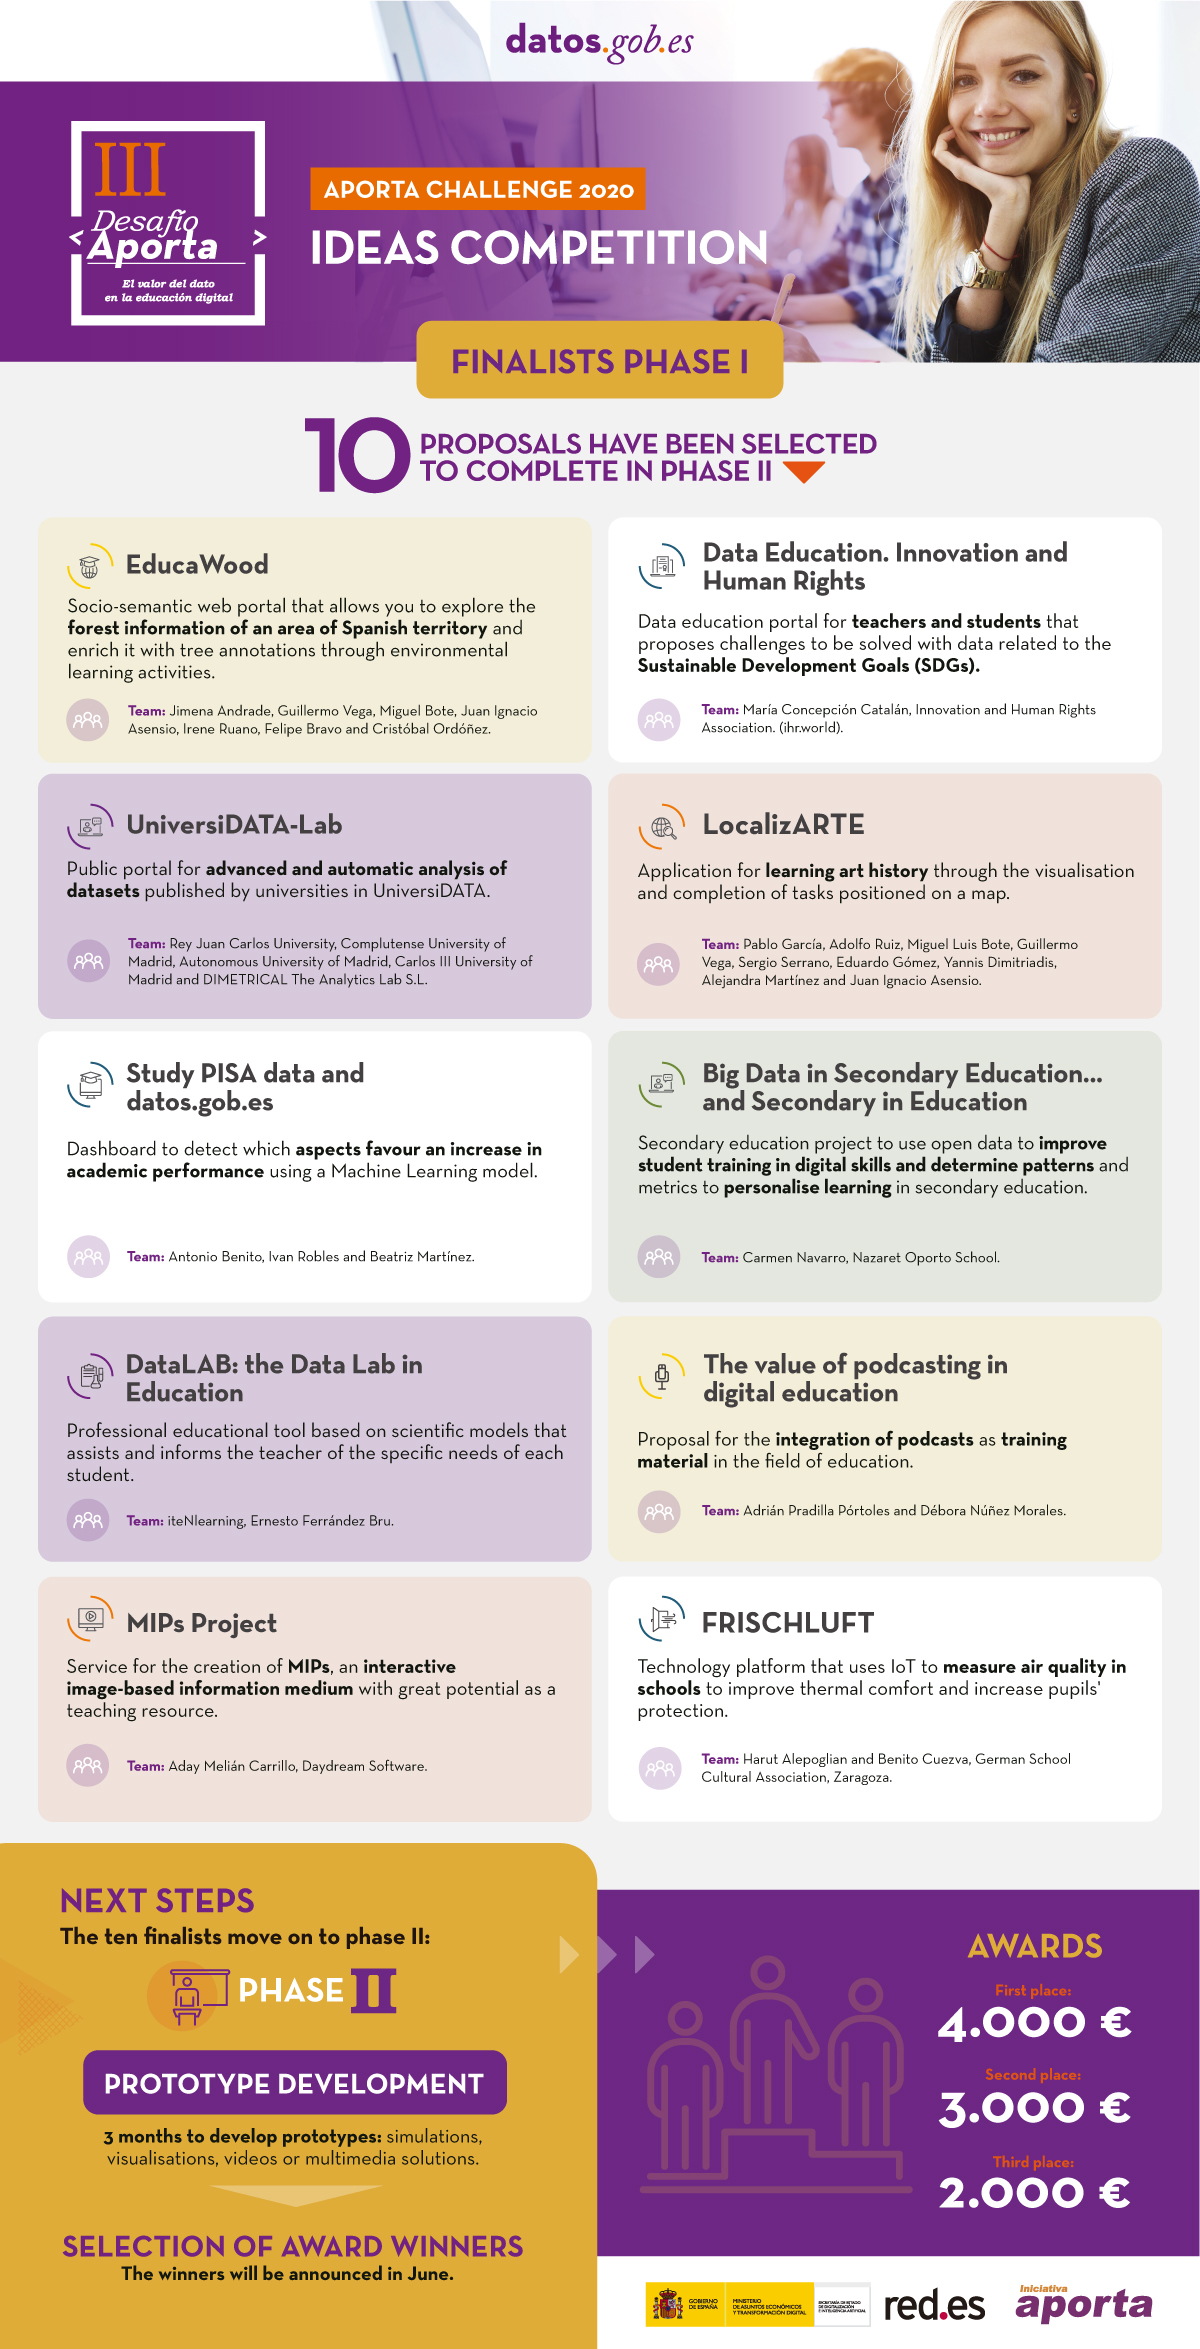
A jury of renowned prestige has been in charge of evaluating the proposals submitted based on a series of public criteria. The 10 solutions selected as finalists are:
EducaWood
- Team: Jimena Andrade, Guillermo Vega, Miguel Bote, Juan Ignacio Asensio, Irene Ruano, Felipe Bravo and Cristóbal Ordóñez.
What is it?
EducaWood is a socio-semantic web portal that allows to explore the forest information of an area of the Spanish territory and to enrich it with tree annotations. Teachers can propose environmental learning activities contextualized to their environment. Students carry out these activities during field visits by means of tree annotations (location and identification of species, measurements, microhabitats, photos, etc.) through their mobile devices. In addition, EducaWood allows virtual field visits and remote activities with the available forestry information and annotations generated by the community, thus enabling its use by vulnerable groups and in Covid scenarios.
EducaWood uses sources such as the Spanish Forest Map, the National Forest Inventory or GeoNames, which have been integrated and republished as linked open data. The annotations generated by the students' activities will also be published as linked open data, thus contributing to community benefit.
Data Education. Innovation and Human Rights.
- Team: María Concepción Catalán, Asociación Innovación y Derechos Humanos (ihr.world).
What is it?
This proposal presents a data education web portal for students and teachers focused on the Sustainable Development Goals (SDGs). Its main objective is to propose to its users different challenges to be solved through the use of data, such as 'What were women doing in Spain in 1920' or 'How much energy is needed to maintain a farm of 200 pigs'.
This initiative uses data from various sources such as the UN, the World Bank, Our World in Data, the European Union and each of its countries. In the case of Spain, it uses data from datos.gob.es and INE, among others.
UniversiDATA-Lab
- Team: Rey Juan Carlos University, Complutense University of Madrid, Autonomous University of Madrid, Carlos III University of Madrid and DIMETRICAL The Analytics Lab S.L.
What is it?
UniversiDATA-Lab is a public and open portal whose function is to host a catalog of advanced and automatic analyses of the datasets published in the UniversiDATA portal, and which is the result of the collaborative work of universities. It arises as a natural evolution of the current "laboratory" section of UniversiDATA, opening the scope of potential analysis to all present and future datasets/universities, in order to improve the aspects analysed and encourage universities to be laboratories of citizenship, providing a differential value to society.
All the datasets that universities are publishing or will publish in UniversiDATA are potentially usable to carry out in-depth analyses, always considering the respect for the protection of personal data. The specific sources of the analyses will be published on GitHub to encourage the collaboration of other users to contribute improvements.
LocalizARTE
- Team: Pablo García, Adolfo Ruiz, Miguel Luis Bote, Guillermo Vega, Sergio Serrano, Eduardo Gómez, Yannis Dimitriadis, Alejandra Martínez and Juan Ignacio Asensio.
What is it?
This web application pursues the learning of art history through different educational environments. It allows students to visualize and perform geotagged tasks on a map. Teachers can propose new tasks, which are added to the public repository, as well as select the tasks that may be more interesting for their students and visualize the ones they perform. On the other hand, a mobile version of LocalizARTE will be developed in the future, in which the user will need to be close to the place where the tasks are geotagged in order to perform them.
The open data used in the first version of LocalizARTE comes from the list of historical monuments of Castilla y León, DBpedia, Wikidata, Casual Learn SPARQL and OpenStreetMap.
Study PISA data and datos.gob.es
- Team: Antonio Benito, Iván Robles and Beatriz Martínez.
What is it?
This project is based on the creation of a dashboard that allows to view information from the PISA report, conducted by the OECD, or other educational assessments along with data provided by datos.gob.es of socioeconomic, demographic, educational or scientific scope. The objective is to detect which aspects favour an increase in academic performance using a machine learning model, so that effective decision-making can be carried out. The idea is that schools themselves can adapt their educational practices and curricula to the learning needs of students to ensure greater success.
This application uses various open data from INE, the Ministry of Education and Vocational Training or PISA Spain.
Big Data in Secondary Education... and Secondary in Education
- Team: Carmen Navarro, Nazaret Oporto School.
What is it?
This proposal pursues two objectives: on the one hand, to improve the training of secondary school students in digital skills, such as the control of their digital profiles on the Internet or the use of open data for their work and projects. On the other hand, the use of data generated by students in an e-learning platform such as Moodle to determine patterns and metrics to personalize learning. All of this is aligned with the SDGs and the 20-30 Agenda.
Data used for its development come from the WHO and the datathon "Big Data in the fight against obesity", where several students proposed measures to mitigate global obesity based on the study of public data.
DataLAB: the Data Lab in Education
- Team: iteNlearning, Ernesto Ferrández Bru.
What is it?
Data obtained with empirical Artificial Intelligence techniques such as big data or machine learning offer correlations, not causes. iteNleanring bases its technology on scientific models with evidence, as well as on data (from sources such as INE or the Basque Institute of Statistics - Eustat). These data are curated in order to assist teachers in decision making, once DataLAB identifies the specific needs of each student.
DataLAB Mathematics is a professional educational tool that, based on neuropsychological and cognitive models, measures the level of neurodevelopment of the specific cognitive processes developed by each student. This generates an educational scorecard that, based on data, informs us of the specific needs of each person (high ability, dyscalculia...) so that they can be enhanced and/or reinforced, allowing an evidence-based education.
The value of podcasting in digital education
- Team: Adrián Pradilla Pórtoles and Débora Núñez Morales.
What is it?
2020 has been the year in which podcasts have taken off as a new digital format for the consumption of different areas of information. This idea seeks to take advantage of the boom of this tool to use it in the educational field so that students can learn in a more enjoyable and different way.
The proposal includes the official syllabus of secondary or university education, as well as competitive examinations, which can be obtained from open data sources and official websites. Through natural language processing technologies, these syllabi are associated with existing audios of teachers on history, English, philosophy, etc. on platforms such as iVoox or Spotify, resulting in a list of podcasts by course and subject.
The data sources used for this proposal include the Public Employment Offer of Castilla La Mancha or the educational competences in different stages.
MIPs Project
- Team: Aday Melián Carrillo, Daydream Software.
What is it?
A MIP (Marked Information Picture) is a new interactive information tool, consisting of a series of interactive layers on static images that facilitate the retention of information and the identification of elements.
This project consists of a service for creating MIPs quickly and easily by manually drawing regions of interest on any image imported through the web. The created MIPs will be accessible from any device and have multiple applications as a teaching, personal and professional resource.
In addition to manual creation, the authors have implemented an automatic GeoJSON to MIP data converter in Python. As a first step, they have developed a MIP of Spanish provinces from this public database.
FRISCHLUFT
- Team: Harut Alepoglian and Benito Cuezva, German School Cultural Association, Zaragoza.
What is it?
The Frischluft (Fresh Air) project is a hardware and software solution for measuring environmental parameters in the school. It aims to improve the thermal comfort of the classrooms and increase the protection of the students through intelligent ventilation, while consolidating a tractor project that drives the digital transformation of the school.
This proposal uses data sources from Zaragoza City Council on CO2 levels in the urban environment of the city and international data repositories to measure global emissions, which are compared through statistical techniques and machine learning models.
Next steps
All of these ideas have been able to capture how to best use data intelligence to develop real solutions in the education sector. The finalists now have 3 months to develop a prototype. The three prototypes that receive the best evaluation from the jury, according to the established evaluation criteria, will be awarded 4,000, 3,000 and 2,000 euros respectively.
Good luck to all participants!
Documentación
In order to extract the full value of data, it is necessary to classify, filter and cross-reference it through analytics processes that help us draw conclusions, turning data into information and knowledge. Traditionally, data analytics is divided into 3 categories:
- Descriptive analytics, which helps us to understand the current situation, what has happened to get there and why it has happened.
- Predictive analytics, which aims to anticipate relevant events. In other words, it tells us what is going to happen so that a human being can make a decision.
- Prescriptive analytics, which provides information on the best decisions based on a series of future scenarios. In other words, it tells us what to do.
The third report in the "Awareness, Inspire, Action" series focuses on the second stage, Predictive Analytics. It follows the same methodology as the two previous reports on Artificial Intelligence and Natural Language Processing.
Predictive analytics allows us to answer business questions such as: Will we suffer a stockout, will the price of a certain share fall, or will more tourists visit us in the future? Based on this information, companies can define their business strategy, and public bodies can develop policies that respond to the needs of citizens.
After a brief introduction that contextualises the subject matter and explains the methodology, the report, written by Alejandro Alija, is developed as follows:
- Awareness. The Awareness section explains the key concepts, highlighting the three attributes of predictive analytics: the emphasis on prediction, the business relevance of the resulting knowledge and its trend towards democratisation to extend its use beyond specialist users and data scientists. This section also mentions the mathematical models it makes use of and details some of its most important milestones throughout history, such as the Kyoto protocol or its usefulness in detecting customer leakage.
- Inspire. The Inspire section analyses some of the most relevant use cases of predictive analytics today in three very different sectors. It starts with the industrial sector, explaining how predictive maintenance and anomaly detection works. It continues with examples relating to price and demand prediction, in the distribution chain of a supermarket and in the energy sector. Finally, it ends with the health sector and augmented medical imaging diagnostics.
- Action. In the Action section, a concrete use case is developed in a practical way, using real data and technological tools. In this case, the selected dataset is traffic accidents in the city of Madrid, published by the Madrid City Council. Through the methodology shown in the following figure, it is explained in a simple way how to use time series analysis techniques to model and predict the number of accidents in future months.

The report ends with the Last stop section, where courses, books and articles of interest are compiled for those users who want to continue advancing in the subject.
In this video, the author tells you more about the report and predictive analytics (only available in Spanish).
Below, you can download the full report in pdf and word (reusable version), as well as access the code used in the Action example at this link.