Documentación
The pandemic that originated last year has brought about a significant change in the way we see the world and how we relate to it. As far as the education sector is concerned, students and teachers at all levels have been forced to change the face-to-face teaching and learning methodology for a telematic system.
In this context, within the framework of the Aporta Initiative, the study "Data-based educational technology to improve learning in the classroom and at home", by José Luis Marín, has been developed. This report offers several keys to reflect on the new challenges posed by this situation, which can be turned into opportunities if we manage to introduce changes that promote the improvement of the teaching-learning process beyond simply replacing face-to-face classes with online training.
The importance of data to improve the education sector
Through innovative educational technology based on data and artificial intelligence, some of the challenges facing the education system can be addressed. For this report, 4 of these challenges have been selected:
· Non-presential supervision of assessment tests: monitoring and surveillance of evaluative tests through telematic resources.
· Identification of behavioral or attention problems: alerting teachers to activities and behaviors that indicate attention, motivation or behavioral problems.
· Personalized and more attractive training programs: adaptation of learning routes and pace of students' learning.
· Improved performance on standardized tests: use of online learning platforms to improve results on standardized tests, to reinforce mastery of a particular subject, and to achieve fairer and more equitable assessment.
To address each of these four challenges, a simple structure divided into three sections is proposed:
1. Description of the problem, which allows us to put the challenge in context.
2. Analysis of some of the approaches based on the use of data and artificial intelligence that are used to offer a technological solution to the challenge in question.
3. Examples of relevant or highly innovative solutions or experiences.
The report also highlights the enormous complexity involved in this type of issues, so they should be approached with caution to avoid negative consequences on individuals, such as cybersecurity issues, invasion of privacy or risk of exclusion of some groups, among others. To this end, the document ends with a series of conclusions that converge in the idea that the best way to generate better results for all students, alleviating inequalities, is to combine excellent teachers and excellent technology that enhances their capabilities. In this process, open data can play an even more relevant role in improving the state of the art in educational technology and ensuring more widespread access to certain innovations that are largely based on machine learning or artificial intelligence technologies.
In this video, the author tells us more about the report:
Noticia
The year 2020 closed with the announcement of the winning projects of two competitions that sought to promote the reuse of open data in two Autonomous Communities: Castilla y León and Euskadi.
Winning projects of the 4th Castilla y León Government Open Data Competition
As in other years, the latest edition of the Junta de Castilla y León's open data competition was aimed at supporting and recognising projects that provide any type of idea, study, service, website or application for mobile devices, using the datasets of the Junta de Castilla y León's Open Data Portal.
A total of eight projects were awarded, divided into different categories as follows:
Ideas category
This category is aimed at those participants who have a great idea even though they do not have the technical capacity, time or resources to implement it.
- The first prize was awarded to Cristina Pérez Fernández and César González Palomo. Their project Castilla y León en remotely presents a search engine for "the ideal population" for those professionals who work remotely and wish to move to a place that will help them to satisfy their desire for a change in lifestyle. Based on the personal preferences of each user, the search engine offers the possibilities that best suit their needs and desires. To do so, it exploits data such as the availability of 4G and/or fibre optic coverage, number of inhabitants in the "ideal population", distance to places of interest, cultural activity, natural environment or average rent/purchase price per square metre.
- The second prize went to Juan Carlos Solís Méndez for his CyL Mobility project. They have put their idea into practice through a first version of a website that brings together all the information collected on the establishments in the autonomous community that are adapted for people with reduced mobility. This is, without a doubt, an idea with a clear social value as it favours the improvement of the quality of life of a vulnerable group.
Products and services category
In this category, they were looking for projects that provided studies, services, websites or applications for mobile devices, that used datasets from the Junta de Castilla y León's Open Data Portal and that were accessible to all citizens via the web by means of a URL.
- The first prize went to the Escovid19data project, a collaborative collection of visualisations and reusable data from COVID-19 by regions in Spain. This project helps to improve the data and information published by the Administration and encourages citizens to become more aware of the serious problem we face.
- The second prize went to the Castilla y León Gurú project, an assistant based on a conversational bot in Telegram that offers users tourist, cultural and leisure information on the community.
- The student award went to TurisCyL, an app for Android mobiles that serves as a travel guide for the autonomous community by offering as much information as possible about tourist sites (restaurants, accommodation, etc.), as well as museums or cultural events.
Didactic Resource Category
Within this section, the creation of innovative open educational resources (with Creative Commons licenses), which support teaching, is encouraged.
- The prize in this category went to the Casual Learn project, an application for Android mobile devices that allows people to learn about art history from buildings and public spaces in Castilla y León. The app suggests learning tasks considering the interests and location of the user. For example, if the user passes near a Gothic church, Casual Learn can suggest taking a photo of its facade and comparing it with that of a nearby Romanesque church.
Data Journalism Category
This category rewards relevant journalistic pieces published or updated in any medium, whether written or audiovisual.
- The first prize in this section went to Coverage of coronavirus diagnostic tests in Spain, a collection of data and reports on the lack of resources and transparency in carrying out diagnostic tests for the COVID-19.
- The second prize went to This is how the coronavirus has affected residences in Castilla y León, an extensive journalistic article on the situation experienced in the residences of Castilla y León at the beginning of the pandemic.
Winners of the Basque Country 2020 Open Data Ideas and Applications Competition
Another of the challenges resolved at the end of the year were the Basque Country Open Data Ideas and Applications competitions, with the aim of publicising and promoting the reuse of open data in the region, organised by the Basque Government together with the Provincial Councils of Alava, Bizkaia and Gipuzkoa and the City Councils of Bilbao, Donostia-San Sebastian and Vitoria-Gasteiz.
Winning projects of the Basque Country Open Data Ideas Competition 2020
The Ideas Competition is aimed at both individuals and companies who wish to submit "ideas for creating products or services derived from open data from the main public data catalogues in the Basque Country". The third edition admitted 30 candidatures, of which two were awarded prizes:
- The first prize in this category went to the Basque Country Seasonal Pollen Forecasting Service project, by Ortzi Torices Roldán and Hodei Goncalves Barkaiztegi. This is a proposal to create a neuronal network to forecast pollen levels in the Basque Country and to offer a public service for people suffering from allergies and respiratory conditions.
- The second prize was awarded to the Ongi etorri Euskal Herrira project, by Iker Díez Arancibia and Alberto Nieto de Pablos. This project proposes an application based on the generation of plans that bring together the types of activities desired by each tourist in a limited geographical area. It offers tourists a graphic representation of the different plans they request and allows for the joint booking of the activities that make up the plan.
Winning projects of the Basque Country Open Data Applications Competition 2020
For its part, the Applications Competition is aimed at both individuals and companies that have created or wish to create "products or services derived from open data from the main public data catalogues in the Basque Country". Of the 28 candidatures admitted, the following have been awarded prizes:
- The first prize was awarded to Smart Public Tender, by Manuel José García Rodríguez, a web platform that includes the latest innovations in the field of public procurement and which helps both public administrations and tendering companies in their decision-making using Machine Learning methodology.
- The second prize was awarded to AvatarParking, by Unai Antero Urruticoechea and Beatriz Arenal Redondo. It is an application that is designed as an assistant for car parks in San Sebastian. By accessing the user's location in real time, it indicates the nearest car park, the number of free spaces available, possible incidents on the way, as well as an estimate of the cost of leaving the car there. The application is designed to be actively carried on the mobile phone and to receive information and commands by voice, thus avoiding distractions with the mobile phone while driving.
Congratulations to all the winners!
Blog
Open data is an increasingly used resource for the training of students at different stages of the education system and for the continuous training of professionals from all sectors. There is already little doubt about the growing importance of all the skills related to data analysis and processing in relation to almost any knowledge discipline. Similarly, skills related to visualization and the construction of stories based on the conclusions drawn from any data analysis or modeling are increasingly needed to complement and extend the ever-necessary skills to communicate and present results of any kind of work.
Throughout the process of training professionals related to data science and artificial intelligence, open data is a valuable resource for gaining practical experience with the techniques and tools that are common in the profession. However, the effects that the use of data, usually open, has on the learning of other subjects, on the acquisition of other types of skills and even on the motivation of students towards learning, are also beginning to be appreciated.
As early as 2013, research that conducted a detailed quantitative comparison of different educational approaches adopted by 39 schools in New York City showed that the use of data to guide the educational programme was one of the five main policies that had an effect on improving academic performance.
Although the use of open data in the classroom has not been widely studied, the limited research conducted so far suggests at first glance that there is a lack of awareness of open data among educators. While we do not have a consolidated understanding of the effect of the use of open data in educational settings as it is not currently a widespread educational resource, there does appear to be a set of early adopter educators who make substantial use of open data in their teaching programmes.
The research "The use of open data as a material for learning" by the Institute of Educational Technology is based on the qualitative analysis of the experience of a group of these pioneering educators to draw a number of conclusions about the value of using open data in teaching.
One of the starting points is that open data does not seem to offer completely new educational or pedagogical methodologies, but rather its use complements existing concepts of teaching and learning such as research-based or project-based learning or personalisation of learning. Two conclusions stand out in this respect:
- Open datasets used as part of learning projects in any subject are usually relevant to the learner, either because they describe issues in their geographical or social environment, or because they relate to current issues or their own hobbies. Research shows that the mere use of these datasets that arouse student curiosity during the learning of any concept has positive effects on the motivation of students to go deeper into the subject and appreciate its usefulness.
- The use of open datasets offers the possibility to propose more advanced activities without increasing the difficulty of the training programme. Examples are cited in the research ranging from the use of open data to support the statistics training of high school students to the use of open scientific databases in the area of genomics to support the teaching of bioinformatics concepts. In this way students can acquire more advanced knowledge and skills that would otherwise probably only have been produced in the field of professional activity or would have been discarded due to insufficient time in the programme. This effect, especially at higher education levels, would also contribute to closing the gap between the education system and professional practice.
Although their effect has not yet been studied, open data competitions are another vehicle for channelling the practical training of students and for creating new educational resources. Increasingly, universities or secondary schools are encouraging teams to participate in regional or national open data competitions as an activity within certain subjects. Some competitions, such as the Castilla y León open data competition, even have a special category with a corresponding prize reserved for the participation of students.
Along the same lines, Barcelona City Council has been organising the Barcelona Dades Obertes Challenge for four years, which aims to bring the benefits of open data closer to the public and to promote its use in the city's educational centres. The challenge combines competition between schools, which have to develop a data-based project, with a specific training plan on open data for teachers, so that they can guide their students.
The fact that there is no more widespread use of open datasets in educational programmes can be attributed to factors such as the lack of teacher training or the difficulty in adapting existing data. Most open datasets come from professional environments such as scientific research or public service administration and learners and educators may not have the literacy or resources to take advantage of them even though tools are emerging that simplify some of the complexities of working with open data. In this regard, a stronger relationship and joint work between educators and learners and dataset producers could also encourage the deployment of more learning programmes.
This is why there are interesting initiatives such as UDIT (Use Open Research Data In Teaching) launched in 2017 with the aim of encouraging and helping higher education teachers to incorporate open research data and other open science concepts into their teaching to improve the learning process.
The International Open Data Charter already recognises the importance of engaging "with schools and higher education institutions to support further open data research and to incorporate data literacy into education programmes". The value of open data in the learning process has not yet been sufficiently explored. As an example, the usual discourse of the open data community always highlights the potential economic and social value of reuse, but not so much the potential of its use in education.
Content prepared by Jose Luis Marín, Senior Consultant in Data, Strategy, Innovation & Digitalization.
The contents and points of view reflected in this publication are the sole responsibility of its author.
Noticia
The open data ecosystem returned to full strength after the summer. During these autumn months, numerous initiatives have emerged to promote the use, reuse and dissemination of open data. They have been very productive weeks, so it has been impossible to collect them all in one post. However, we present you a small selection that will surely be of your interest.
Tools and applications to access more open data
We begin the review of the new developments that have emerged this fall in the open data ecosystem with the initiatives that have been encouraged to make available public data through various tools. We present you some of them:
- Castellón Provincial Council has presented its open data observatory, a great platform of updated information that includes indicators with the actions carried out by the Council to address the COVID, an area of good practice, a section with information on the Council of Reusers and the Provincial Council's Open Data Portal.
- Valencia City Council has renewed its Geoportal with the Smart City app, which shows thousands of open data of the city in fields such as mobility, wifi points, gardening, markets, sports or cultural elements.
- The University of Extremadura has made public its new research portal. The portal automatically collects the scientific and transfer production of the researchers without requiring any effort from the user.
- Ponferrada City Council, together with the company Rendytel, has presented a project to measure air quality in public spaces and buildings using technology based on IoT devices, which provide open data to all citizens. Through their mobile phones, users can find out the state of the air and the level of ventilation in real time and, therefore, assess the possible risk of contagion of Covid-19.
Although this is not a new initiative, we would like to take this opportunity to highlight that the Junta de Castilla y León has received the NovaGob Excellence Award for its work on transparency when displaying data on its portal.
Examples of reuse
Did you know that public bodies, in addition to continuing to open up their information, also continue to create services and products based on its reuse? Here are three examples from this fall:
- The University of Valladolid has developed the application 'Casual Learn', which is based on open data to help users learn art history. The application suggests learning tasks taking into account the interests and location of the user.
- Casual Learn was one of the winning projects in the 4th Castilla y León Open Data Competition, in this case in the category of Teaching Resources. In the Products and Services category, the winner was "Escovid19data", a collaborative collection of data from COVID-19 by province in Spain, while "Castilla y León en remoto" took first place in the ideas category and "Coverage of coronavirus diagnostic tests in Spain" in the data journalism category.
- Onda Town Council has presented an app which offers information on free parking spaces, traffic conditions, environmental parameters and pharmacies on duty. This application is part of the Onda Smart City project, a project which turned out to be the winner of the 12th Aslan Awards, as we reported a few months ago.
In addition to public bodies, we also want to highlight the work done by the four young Basques who have created Dataseeds, a platform at the service of European agricultural SMEs to offer a large amount of open data and facilitate their evolution towards a green transition. With their solution, they have come third in the "A European Green Deal" challenge in the EU Datathon 2020.
Events, courses and publications aimed at disseminating open data
But if there is a reason why autumn has stood out, it has been because of the great number of events, competitions, webinars and other activities aimed at promoting open data.
- Este otoño Asedie ha estrenado nuevo blog. Entre los contenidos que aborda destaca la transformación digital, la inteligencia artificial o los datos abiertos, siempre con el foco puesto en las empresas infomediarias.
- La Iniciativa Aporta acompañó a Databeers Málaga en su primera edición online, que este año estuvo dedicada a los datos abiertos de Copernicus. Si quieres conocer más sobre nuestra participación en esta jornada, puedes hacerlo aquí.
- The Government Obert Chair promoted by the Polytechnic University of Valencia, has transferred to the participants in the Autumn Camp of Transparency and Data Management, the foundations for the understanding of concepts related to open data management. In addition, the Valencian Community has announced during this period that it will train companies and professionals in smart city technologies through the project 'Ciudades conectadas y habitable'.
- Open data not only serves to bring applications to life, but also to enrich journalistic and literary works. The Generalitat de Catalunya has published the book "Open data and artificial intelligence, tools for gender equality". This writing allows us to reflect on how open data is also a key element in the fight against gender discrimination.
- Open data competitions have been a constant throughout the autumn: the Aporta Challenge, the Basque Country Open Data competition, BiscayApp...
Some international proposals
At the international level, some very interesting initiatives have also emerged this autumn.
- The World Bank has launched an open water data portal to help countries make informed decisions that will lead to a water-secure world.
- During these months, the European Data Portal has organized different webinars to address the future of open data portals, where experiences, good practices and opportunities for action have been shown to ensure that open data portals remain useful for the community. These webinars will run until January.
- We end with an international news, but with a local component. Brussels awards a Spanish consortium Yoda, its new European project based on open data. This is the development of a platform for any European citizen to create their own personalized board where they can order different sources of information according to their interests.
These are just some of the most prominent examples that have emerged in the world of open data during the autumn months of 2020. However, if you know of any other news that may be of interest, please do not hesitate to mention it in the comments or send us an email to dinamizacion@datos.gob.es.
Documentación
The saying "a picture is worth a thousand words" is a clear example of popular wisdom based on science. 90% of the information we process is visual, thanks to a million nerve fibers that link the eye to the brain and more than 20,000 million neurons that perform the processing of the impulses received at high speed. That is why we are able to remember 80% of the images we see, while in the case of text and sound the percentages are reduced to 20% and 10%, respectively.
These data explain the importance of data visualization in any sector of activity. It is not the same to tell how an indicator evolves, as to see it through visual elements, such as graphs or maps. Data visualization helps us understand complex concepts and is an accessible way to detect and understand trends and patterns in the data.
Data Visualization and Smart Cities
In the case of Smart Cities, where so much information is generated and captured, data visualization is fundamental. Throughout the length and breadth of a smart city, there are a large number of sensors and smart devices, with different detection capabilities, which generate a large amount of raw data. To give an example, only the city of Barcelona has more than 18,000 sensors spread throughout the city that capture millions of data. This data allows from real time monitoring of the environment to informed decision making or accountability. Visualizing this data through visual dashboards speeds up all these processes.
To help Smart Cities in this task, from the Open Cities project, led by Red.es and four city councils (A Coruña, Madrid, Santiago de Compostela and Zaragoza), a series of visualization tools have been selected and an extension has been developed for CKAN similar to the functionality "Open With Apps", initially designed for the Data.gov portal, which facilitates the integration with this type of tools.
The integration method inspired by "Open with Apps"
The idea behind "Open With Apps" is to allow integration with some third party services, for some formats published in the open data portals, such as CSV or XLS, without the need to download and upload data manually, through the APIs or URIs of the external service.
But not all display systems allow this functionality. Therefore, since the Open Cities project they have analyzed several platforms and online tools for creating visualizations and data analysis, and have selected 3 that meet the necessary characteristics for the described operation:
- The integration is done through links to websites without the need to download any software.
- In the invocation it is only necessary to pass as a parameter the download URL of the data file.
The result of this analysis has given rise to the report "Analysis and definition of specifications for integration with external visualization systems", where 3 tools that comply with these functionalities are highlighted.
3 simple data visualization and analysis tools
According to the aforementioned report, the 3 platforms that meet the necessary characteristics to achieve such operation are:
- Plotly: facilitates the creation of interactive data visualizations and control panels to share online with the audience. More advanced users can process data with any custom function, as well as create simulations with Python scripts. Supported formats are CSV, TSV, XLS and XLSX.
- Carto: formerly known as CartoDB, it generates interactive maps from geospatial data. The maps are automatically created and the user can filter and refine the data for more information. It accepts files in CSV, XLS, XLSX, KML (Google Earth), KMZ, GeoJSON and SHP formats.
- Geojson.io: allows to visualize and edit geographic data in GeoJSON format, as well as to export to a large number of formats.
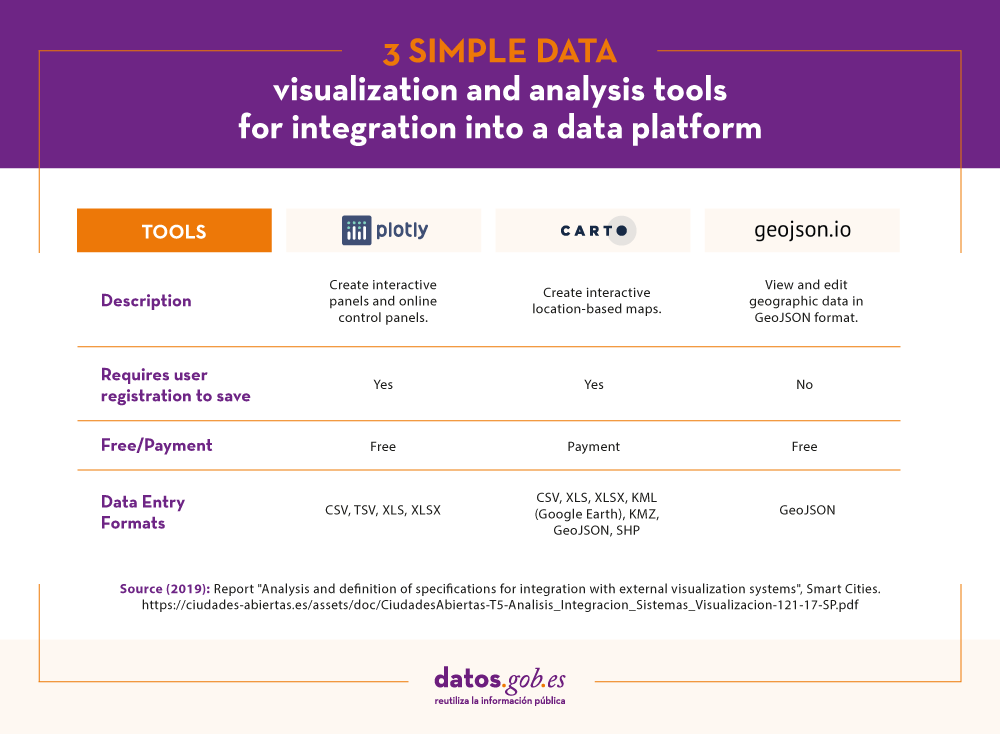
For each of these tools the report includes a description of its requirements and limitations, its mode of use, a generic call and specific examples of calls along with the result obtained.
The "Open with" extension
As mentioned above, within the project a CKAN extension called "Open with" has also been developed. This extension allows to visualize the data files using the external visualization systems described above. It can be accessed through the project's GitHub account.
The report explains how to carry out its installation in a simple way, although if any doubt arises about its operation, users can contact Open Cities through the e-mail contacto@ciudadesabiertas.es.
Those interested in other CKAN extensions related to data visualization have at their disposal the report Analysis of the Visualization Extensions for CKAN, carried out within the framework of the same initiative. In the Gighub account, it is expected that examples of visualizations made will be published.
In short, data visualization is a fundamental leg of Smart Cities, and thanks to the work of the Open Cities team it will now be easier for any initiative to integrate simple data visualization solutions into their information management platforms.
Blog
Climate change, air pollution and sea pollution. These are the 3 main environmental problems for Spanish citizens according to the latest Eurobarometer "Attitudes of European citizens towards the Environment", published in March 2020. The survey also highlights that 90% of the Spanish population considers to protect the natural environment important. Citizens want more action to be taken and believe that responsibility should be shared between companies, national governments, the EU and citizens themselves.
As with other sectors, such as education or health, open data can also help us to overcome environmental challenges. On the one hand, it provides us with detailed information to understand the situation and to be able to look for solutions. On the other hand, they serve to implement solutions that help us raise awareness and reduce our environmental footprint.
In its report "The Economic Impact of Open Data Opportunities for value creation in Europe”, ", the European Data Portal highlights that data can "contribute to reducing total energy consumption in Europe, increasing the use of sustainable energy sources, protecting biodiversity and raising awareness of CO2 emissions", as well as generating an economic impact of around 1€ billion. Let's look at some examples:
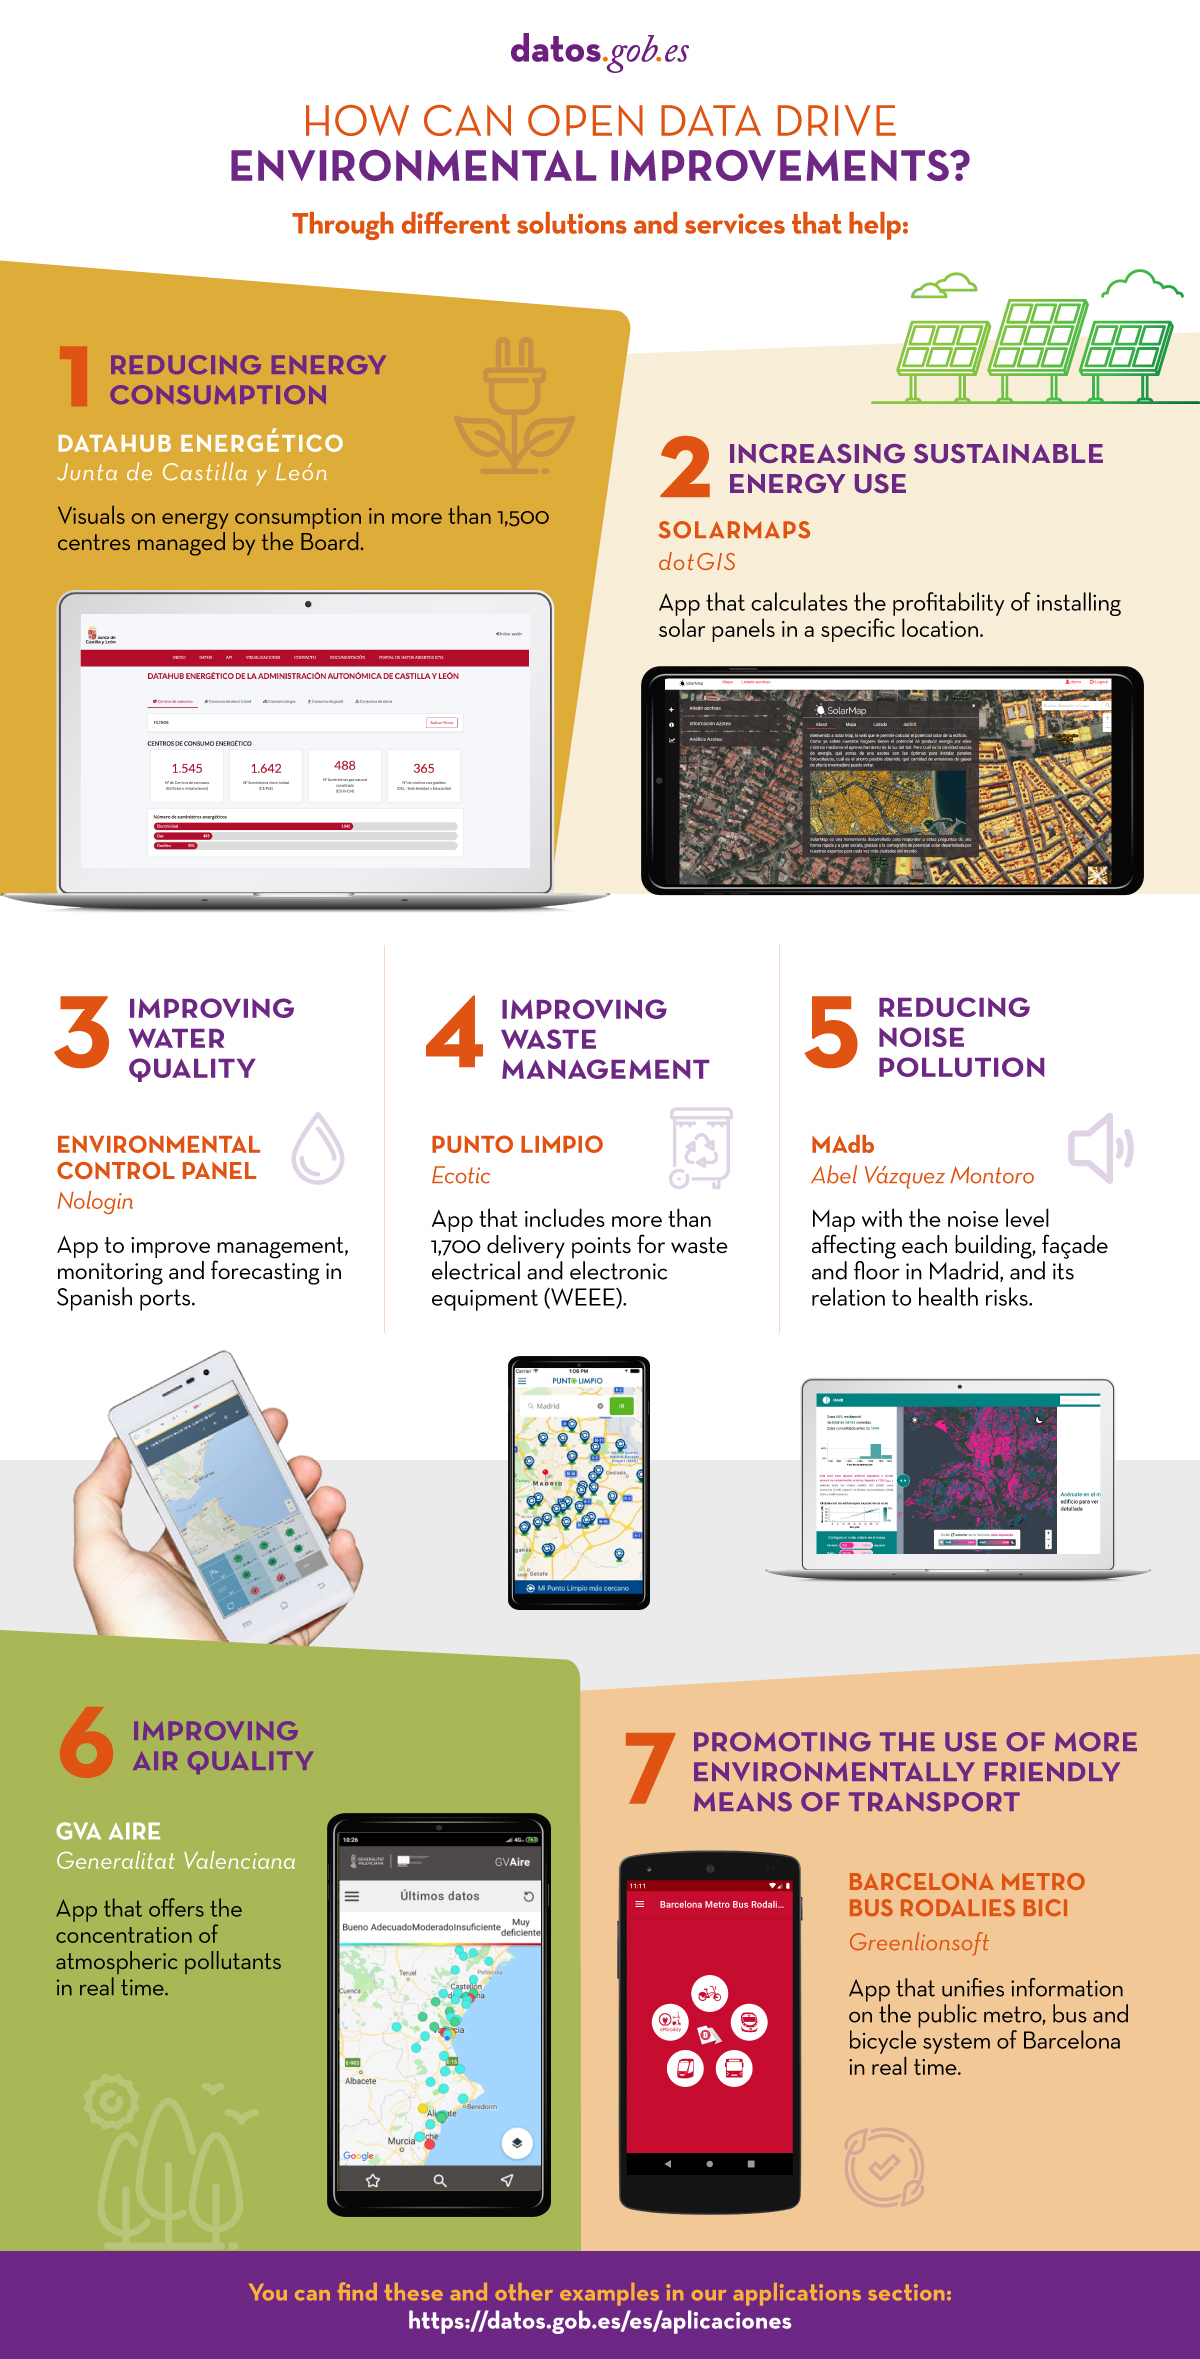
- Reducing energy consumption. Open data-based applications can serve as a tool to help households and institutions to understand and reduce their energy consumption. In this sense, the Regional Government of Castilla y León has launched an Energy Datahub that provides detailed and visual information on energy consumption in the more than 1,500 centres managed by the Regional Government: educational centres, health centres, administrative offices, hospitals, etc. The scorecard facilitates the disaggregated analysis by type of energy (electricity, gas, diesel) and by geographical location, allowing informed decisions to be made. According to the Board itself, thanks to the energy scorecard they have saved more than 12 million euros in electricity since 2015.
- Increase the use of sustainable energy. The 2018 EU directive on the promotion of the use of energy from renewable sources sets a target for the share of renewable energy in gross final consumption to be 32% by 2030. To help achieve this target, publicly available data on urban planning, use of public services or weather conditions can be cross-checked to create solutions that help make housing more sustainable. One example is Solarmap, which allows the profitability of a solar panel installation to be calculated for a specific location.
- Improving biodiversity: Changes in ecosystems can lead to mass extinctions of species and the limitation of available natural resources, which can affect not only our economy but also our own way of life. In this sense, open data serves as a basis for solutions that, for example, help us monitor various parameters of port waters (such as Environmental Control Panel), improve waste management (Punto limpio) or publicise noise pollution (MAdb).
- Raise awareness of air pollution and the reduction of CO2 emissions. Although, as we saw at the beginning of this article, we Spaniards are very aware of climate change, however, if we look at the individual habits of citizens, we see that there is still much to be done. Only 38% try to reduce their energy consumption, 28% choose less polluting forms of transport, and 36% buy local products. It is therefore necessary to continue raising awareness, for example through indicators of air quality in cities such as GV Aire. There is also a need for applications that promote the use of more efficient means of transport, such as bicycles or public transport (Barcelona metro bus rodalies bici).
You can find more examples in the applications section of datos.gob.es and in our environment section.
Documentación
A large number of different data sources with different contents and formats coexist in an open data portal. It is therefore necessary to provide each file, resource or content on the network with a context or definition that allows people, and also machines, to interpret its meaning. This is where the concept of Linked data comes in.
Linked Data allows the web to be used as a single large global database. Following this publishing paradigm, data is available in context and interconnected for reuse. Linked Data emerged from the Semantic Web project inspired by Tim Berners-Lee, the father of the Web, from the need to introduce contextual information in the form of metadata on the Web.
The document "LinkedData as an open data model" briefly explains the basic concepts to understand how the semantic web and linked data works, such as the case of URIs or unique resource identifiers, ontologies or vocabularies that allow the description of relationships between them, to focus on how Aragon has implemented these technologies to develop different services, such as:
- The Interoperable Information Structure (EI2A), an ontology that homogenises structures, vocabularies and characteristics to respond to the diversity and heterogeneity of existing data within the Administration, within the framework of Aragon Open Data. The document explains some of the ontologies and vocabularies used for the development.
- The European Legislation Identifier (ELI), which allows online access to legislation in a formalised format that facilitates its reuse.
- The semantic infrastructure in Aragon Open Data, where the use of the Virtuoso tool for the storage of linked data stands out. The document explains the characteristics of this universal server, whose architecture allows the persistence of data in RDF-XML formats, among others. In addition, it explains how the bank that stores triplets in a native way for resources relationships works and shows examples of services of Aragon Open data that exploit these triplets of data as Aragopedia and Aragon Open Data Pool.
You can then download the full document (only available in Spanish).
This document is part of the series of educational materials and technological articles that Aragón open Data is producing in order to explain how they have deployed different solutions to respond to the needs for location, access and reuse of the different sets of data. You can complete your reading with another volume in the series: "How to implement CKAN: real case of the Aragon Open Data portal".
Documentación
Aragon Open Data is one of the most active open data initiatives on the Spanish scene. In addition to the implementation, management and maintenance of an interoperable data catalogue, since its inception Aragon Open Data has carried out actions to bring the culture of open data closer to citizens, companies and all types of organisations. These initiatives include the development of services to offer the data and facilitate its reuse in a simple way such as Aragopedia, Open Social Data or the recent Aragón Open Data Focus (more information available in this interview).
Given the knowledge that they hold, it is not surprising that they have begun to develop educational materials and technological articles with the aim of explaining how they have deployed different solutions to respond to the needs of localisation, access and reuse of the different sets of data.
Below is one such material, which focuses on explaining how they have implemented the CKAN software solution to improve the availability of data on the portal.
CKAN as an open data management software solution in a real case for the Aragon Open Data portal
CKAN is a free, open-source platform developed by the Open Knowledge Foundation for publishing and cataloguing data collections. Due to its free and open nature, as well as its rapid implementation, it has become a worldwide reference for the opening of data.
Since its birth in 2012, Aragon Open Data has bet on CKAN technology for the management of its open data system. The document "CKAN, cornerstone for the management of an open data system" shows us how its architecture works and serves as an example for other initiatives that want to implement a platform of this type.
The document describes the challenges they encountered when migrating the original platform to a higher version and how they solved it by building a client application. This process resulted in the current architecture of the portal, which is shown in the figure below:
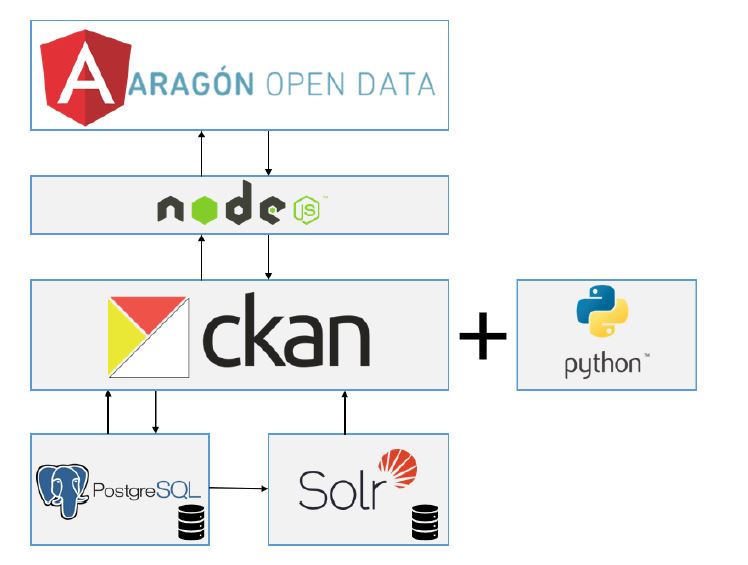
The CKAN backend is developed entirely in Python, with its own Javascript front end, and allows the deployment of a layer of services that can be managed from an API, and the use of base plugins or extensions that provide additional functionalities to the platform. CKAN is supported by a PostgreSQL database, where the datasets it houses, its resources and other metadata required for the operation of the platform are stored, and makes use of Solr, a search engine that helps to speed up the location and availability of the datasets.
In addition to explaining this architecture, the document discusses the functionalities and extensions used in the customised CKAN instance, and how the set of components integrated into the platform: Angular, NodeJS, PostgreSQL and Solr coexist to provide data sets that are the basis for the development of open data services and solutions such as Presupuestos de Aragón or the already mentioned Aragón Open Data Focus.
CKAN incorporates an extension that supports RFD data serialisation which, in addition to allowing the exposure of linked data in formats such as RDF-XML or Turtle, is used to federate datasets that follow the DCAT specification of metadata, making CKAN a more versatile and appropriate platform for the publication of Linked Data, something that Aragon Open Data has also done as we can see in this other document.
You can download the document "CKAN as an open data management software solution in a real case for the Aragon Open Data portal" below (only available in Spanish). You can also complement your reading with these two additional articles:
- Automatic collection of open data: Explains how Aragon Open Data federates open data using a CKAN plugin.
- ELK architecture as an open data tool: Explains how Aragon Open Data uses an architecture based on the ELK technology stack (Elasticsearch, Logstash and Kibana).
Blog
Is it possible to find in the data the necessary help to solve the real problems that our society faces? While it is true that data alone cannot be transformed into food for the most disadvantaged, nor can it make weapons disappear in conflict zones or inequalities in the world, they are very useful when it comes to providing information on the causes that cause certain events or situations. Thanks to them, we can better assess the reasons and consequences of these situations, and act so that they do not recur.
Once, thanks to open data, we identify the causes that cause these types of events, we must take one more step: use this information to develop solutions and services that help us solve problems such as, for example, the lack of social inclusion of marginalized groups or inequalities caused by gender, economic or social issues.
When we speak of inclusion, we refer to the process by which both individuals and communities of people, such as migrants, refugees, socially disadvantaged groups or individuals, can interact and integrate in their communities in a satisfactory way and with the same opportunities.
Next, we will see some examples of the importance of open data when creating instruments and services that help the integration of this type of groups, focusing especially on the challenges that our country faces.
Problems related to inequality in Spain and digital solutions based on open data to solve them
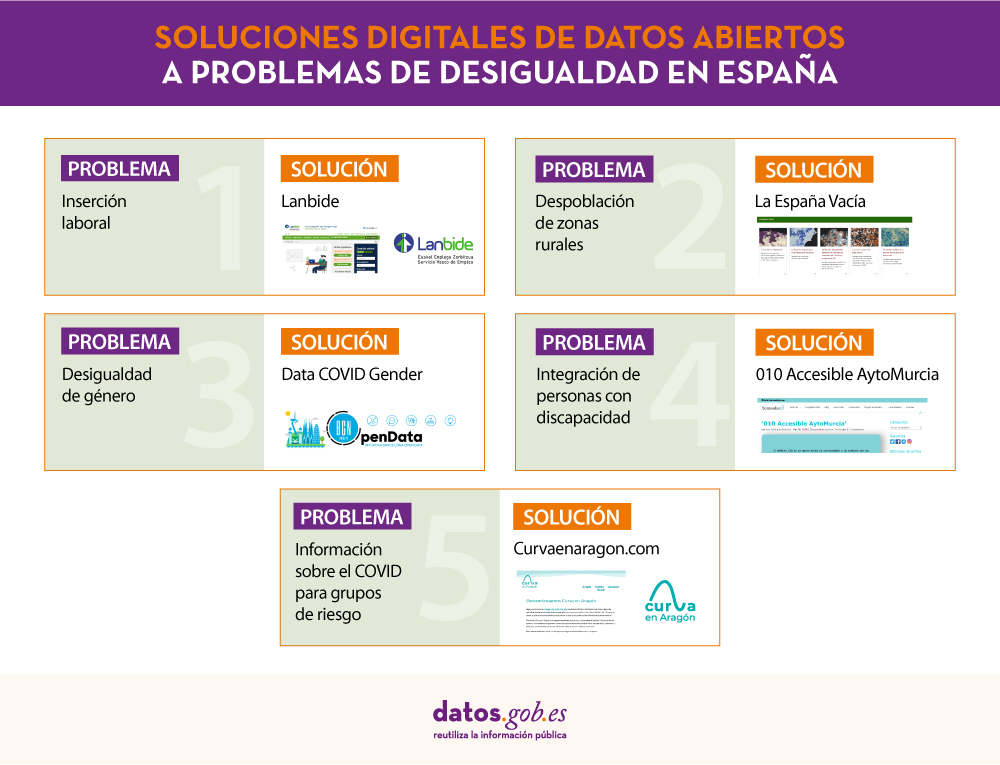
Labor insertion
In a context where the health crisis is damaging our economy, it is essential to bring job opportunities closer to citizens. The open publication of job offers and courses, as the Basque Employment Service does through its Lanbide platform, is allowing many job web portals and training centers to add these offers to their catalog easily, promoting their dissemination and , therefore, the labor insertion of job seekers.
Depopulation of rural areas
Currently in Spain it is necessary to make users more visible and aware of the great depopulation problem suffered by some areas of our country, in which its inhabitants have less and less social resources, which sometimes leads to increasing their isolation.
Tool such as "La España Vacía", which consists of a series of interactive maps that show the Spanish demographic evolution, help us to make visible and understand the problem, while platforms such as Plan Repuebla can serve to attract businesses and new inhabitants to areas with lower population density.
Gender inequality
There are platforms that function as a great channel of awareness and support for women victims of sexist violence, offering testimonies and analysis of the current situation. This is the case of Desprotegides, a portal created in Catalonia that seeks to make visible the serious problem of sexist violence suffered by thousands of women in the world today, in this case with updated data on the number of victims in the Catalan community.
One step further goes the Data COVID Gender project created by the Barcelona Open Data Initiative together with the Gender and ICT group (GENTIC) of the Internet Interdisciplicary Institute (IN3). The project consists of analyzing the impact that gender and occupational segregation have on the prevalence of the coronavirus. It has been one of the 15 proposals chosen by the Catalan Health Quality and Evaluation Agency (Aquas) of the Department of Health to carry out research in data analytics on the incidence of SARS-CoV-2 and Covid-19 in Catalonia.
Integration of people with disabilities
In recent years, simple applications that, using open data, provide useful information about the environment. In this article you can find different applications created by companies and citizens, but also public services are working in this regard. As an example, the city of Murcia has launched a free application that allows people with hearing disabilities to receive information about municipal services and carry out the procedures they request by way of videoconference through a smartphone.
Relevant information about the coronavirus for risk groups
Curvaenaragon.com is a web page developed by the Government of Aragon whose main objective is to show updated information on the situation of Covid-19 in the autonomous community, breaking down the data by the different provinces (Huesca, Zaragoza and Teruel).
This website allows all citizens who reside or have to travel to Aragon to consult the evolution of the pandemic in the area, especially for the risk groups that are most vulnerable to this pathology.
In short, there are more and more applications and technologies that, thanks to open data, allow us to obtain useful information about the environment in order to offer solutions to problems such as inequality, disability, poverty or violence, among others.
These are just some examples of applications that use open data to favor the eradication of inequality, but if you know of any other that fulfills a similar function, do not hesitate to register it on our portal or send us an email to contacto@datos.gob.es
Content elaborated by datos.gob.es team.
Entrevista
Now that the call for the third edition of the Aporta Challenge is open, in this occasion focused on the field of education, we have talked to the winner of the 2019 edition, Mariano Nieves, who won thanks to his Optimacis solution. Mariano explained his experience and gave us some advice for this year's participants.
Full interview:
1. What does Optimacis consist of?
Optimacis is a project for the optimisation of the fresh fish market, which seeks to balance prices against monopsony situations.
The success of the project lies in the delivery of value for the three main actors in these markets:
- the fishing companies as producers
- wholesalers and hospitality companies as mediators in the delivery to the market;
- and the fish markets themselves as primary distribution centres.
The values for each actor are specific: in the case of fishermen, by means of advance knowledge of the most advantageous prices for sale; in the case of wholesalers and restaurateurs, by means of knowledge of the supply points with the greatest capacity; and in the case of fish markets, by means of advance knowledge of the expected influx into their facilities, for the internal organisation of resources.
2. What prompted you to participate in the Aporta Challenge?
Without a doubt, the institutional support of datos.gob.es is a reference in the Public Administration, given that the project has a marked character of sustainability for a group that usually requires additional resources to the exploitation.
It was not a preconceived project that came to take advantage of the call. On the contrary, the project was developed after reading the call for proposals. In all honesty, I even asked a formal question at the Red.es website to make sure that fishing was an area covered by the 2019 Aporta Challenge.
I thought that having the recognition and dissemination of the Aporta Challenge would boost my professional career, as it has. This is a value that I want to highlight to encourage other participants in the new call: there are currently many professionals with an impressive career, who can make their CV shine with success in the Aporta Challenge.
3. How was your experience?
The challenge was impressive. For those who know the exciting world of data, I think it is important to stress the importance of handling more than 3,500 predictive models in real time (well, with a 24-hour regeneration cycle).
This is supported by various sources of ingestion, highlighting the information from Meteogalicia and the State Agency of Meteorology, the ingestion in real time from two radar systems (actually, they are called Automatic Identification Systems) located in As Pontes de García Rodríguez and Vigo, and the daily extraction of the price data published from the Galician fish markets.
Shuffling all these sources of information in record time (with seven machines working in continuous mode 24x7), ingesting and monitoring the predictive models was a major effort for me, to which I dedicated the entire summer of 2019. And the months of September and October was dedicated to geolocation and machine learning tasks.
The main advantage that the challenge has given me has been to know sources of large masses of data that are available for projects of all kinds, with the solvency of the sources of the Public Administration.
4. What is the current status of the development of the Optimacis System?
We are already in a phase of promoting the solution, in order to coordinate with public bodies that promote sustainable projects in the field of fisheries at a state, local and regional level. The balance of the market conditions is being a factor that awakens interest in local administrations.
5. What advice would you give to participants in the Aporta 2020 Challenge?
Well, only from my partition experience of course. I think that the dedication and effort were decisive in my case, because the rest of the participants had a very high level to which I could not aspire. Most of them were groups of people, while my participation was of a personal nature. However, the fact that I was able to build this whole block of predictive models and carefully review the results was decisive.
On the other hand, I think it also helped that I took meticulous care of the presentation. The fact that I carefully wrapped the content was well appreciated, as I had a fully functional model.
6. Closing and farewell.
I want to convey all the encouragement to the participants of this call, and not hesitate to include dedication and effort because it is worth it. Not every day you receive recognition from a government institution like datos.gob.es. May the best one win!