Blog
Today, no one can deny that open data holds great economic power. The European Commission itself estimates that the turnover of open data in the EU27 could reach 334.2 billion in 2025, driven by its use in areas linked to disruptive technologies such as artificial intelligence, machine learning or language technologies.
But in addition to its economic impact, open data also has an important value for society: it provides information that makes social reality visible, driving informed decision-making for the common good.
There are thousands of areas where open data is essential, from refugee crises to the inclusion of people with disabilities, but in this article we will focus on the scourge of gender violence.
Where can I obtain data on the subject?
Globally, agencies such as the UN, the World Health Organization and the World Bank offer resources and statistics related to violence against women.
In our country, local, autonomous and state agencies publish related datasets. To facilitate unified access to them, the Government Delegation against Gender Violence has a statistical portal that includes in a single space data from various sources such as the Ministry of Finance and Public Administration, the General Council of the Judiciary or the Public Employment Service of the Ministry of Employment and Social Security. The user can cross-reference variables and create tables and graphs to facilitate the visualization of the information, as well as export the data sets in CSV or Excel format.
Projects to raise awareness and visibility
But data alone can be complicated to understand. Data need a context that gives them meaning and transforms them into information and knowledge. This is where different projects arise that seek to bring data to the public in a simple way.
There are many associations and organizations that take advantage of published data to create visualizations and stories with data that help to raise awareness about gender violence. As an example, the Barcelona Open Data Initiative is developing the "DatosXViolenciaXMujeres" project. It is a visual and interactive tour on the impact of gender violence in Spain and by Autonomous Communities during the period 2008-2020, although it is updated periodically. Using data storytelling techniques, it shows the evolution of gender violence within the couple, the judicial response (orders issued and final convictions), the public resources allocated, the impact of COVID-19 in this area and crimes of sexual violence. Each graph includes links to the original source and to places where the data can be downloaded so that they can be reused in other projects.
Another example is "Datos contra el ruido” (Data against noise), developed within the framework of GenderDataLab, a collaborative platform for the digital common good that has the support of various associations, such as Pyladies or Canodron, and the Barcelona City Council, among others. This association promotes the inclusion of the gender perspective in the collection of open data through various projects such as the aforementioned "Dotos contra el ruido", which makes visible and understandable the information published by the judicial system and the police on gender violence. Through data and visualizations, it provides information on the types of crimes or their geographical distribution throughout our country, among other issues. As with "DatosXViolenciaXMujeres", a link to the original source of the data and download spaces are included.
Tools and solutions to support victims
But in addition to providing visibility, open data can also give us information on the resources dedicated to helping victims, as we saw in some of the previous projects. Making this information available to victims in a quick and easy way is essential. Maps showing the location of help centers are of great help, such as this one from the SOL.NET project, with information on organizations that offer support and care services for victims of gender-based violence in Spain. Or this one with the centers and social services of the Valencian Community aimed at disadvantaged groups, including victims of gender violence, prepared by the public institution itself.
This information is also incorporated in applications aimed at victims, such as Anticípate. This app not only provides information and resources to women in vulnerable situations, but also has an emergency call button and allows access to legal, psychological or even self-defense advice, facilitating access to a social criminologist.
In short, we are facing a particularly sensitive issue, which we must continue to raise awareness and fight to put an end to. A task to which open data can make a significant contribution.
If you know of any other example that shows the power of open data in this field, we encourage you to share it in the comments section or send us an email to dinamizacion@datos.gob.es.
Content prepared by the datos.gob.es team.
Blog
Today, Artificial Intelligence (AI) applications are present in many areas of everyday life, from smart TVs and speakers that are able to understand what we ask them to do, to recommendation systems that offer us services and products adapted to our preferences.
These AIs "learn" thanks to various techniques, including supervised, unsupervised and reinforcement learning. In this article we will focus on reinforcement learning, which focuses mainly on trial and error, similar to how humans and animals in general learn.
The key to this type of system is to correctly set long-term goals in order to find an optimal global solution, without focusing too much on immediate rewards, which do not allow for an adequate exploration of the set of possible solutions.
Simulation environments as a complement to open data sets.
Unlike other types of learning, where learning is usually based on historical datasets, this type of technique requires simulation environments that allow training a virtual agent through its interaction with an environment, where it receives rewards or penalties depending on the state and actions it performs. This cycle between agent and environment can be seen in the following diagram:
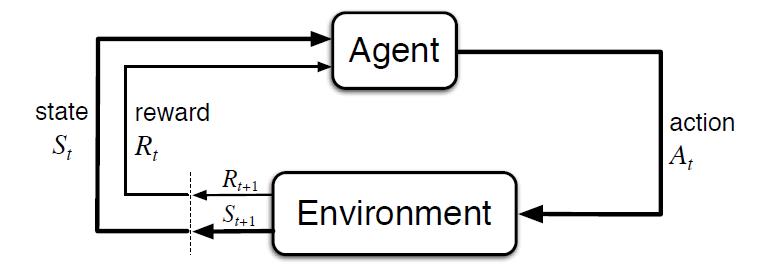
Figure 1 - Scheme of learning by reinforcement [Sutton & Barto, 2015]
That is, starting from a simulated environment, with an initial state, the agent performs an action that generates a new state and a possible reward or penalty, which depends on the previous states and the action performed. The agent learns the best strategy in this simulated environment from experience, exploring the set of states, and being able to recommend the best action policy if configured appropriately.
The best-known example worldwide was the success achieved by AlphaGo, beating 18-time world champion Lee Sedol in 2016. Go is an ancient game, considered one of the 4 basic arts in Chinese culture, along with music, painting and calligraphy. Unlike chess, the number of possible game combinations is greater than the number of atoms in the Universe, being a problem impossible to solve by traditional algorithms.
Curiously, the technological breakthrough demonstrated by AlphaGo in solving a problem that was claimed to be beyond the reach of an AI, was eclipsed a year later by its successor AlphaGo Zero. In this version, its creators chose not to use historical data or heuristic rules. AlphaGo Zero only uses the board positions and learns by trial and error by playing against itself.
Following this innovative learning strategy, in 3 days of execution he managed to beat AlphaGo, and after 40 days he became the best Go player, accumulating thousands of years of knowledge in a matter of days, and even discovering previously unknown strategies.
The impact of this technological milestone covers countless areas, and AI solutions that learn to solve complex problems from experience can be counted on. From resource management, strategy planning, or the calibration and optimization of dynamic systems.
The development of solutions in this area is especially limited by the need for appropriate simulation environments, being the most complex component to build. However, there are multiple repositories to obtain open simulation environments that allow us to test this type of solutions.
The best known reference is Open AI Gym, which includes an extensive set of libraries and open simulation environments for the development and validation of reinforcement learning algorithms. Among others, it includes simulators for the basic control of mechanical elements, robotics applications and physics simulators, two-dimensional ATARI video games, and even the landing of a lunar module. In addition, it allows to integrate and publish new open simulators for the development of our own simulators adapted to our needs that can be shared with the community:
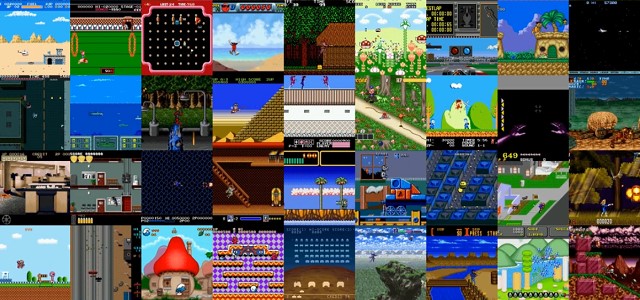
Figure 2 - Examples of visual simulation environments offered by Open AI Gym
Another interesting reference is Unity ML Agents, where we also find multiple libraries and several simulation environments, also offering the possibility of integrating our own simulator:
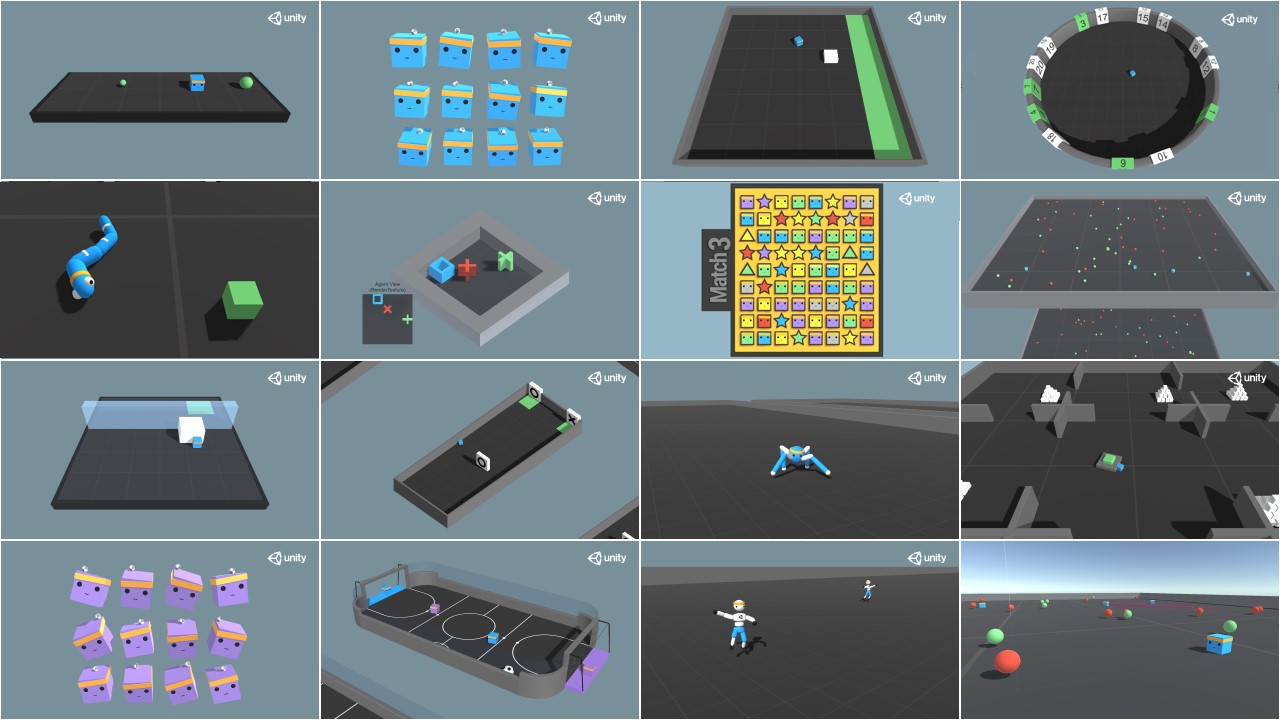
Figure 3 - Examples of visual simulation environments offered by Unity ML Agents
Potential applications of reinforcement learning in public administrations
This type of learning is used especially in areas such as robotics, resource optimization or control systems, allowing the definition of optimal policies or strategies for action in specific environments.
One of the best-known practical examples is the DeepMind algorithm used by Google to reduce by 40% the energy consumption required to cool its data centers in 2016, achieving a significant reduction in energy consumption during use, as can be seen in the following graph (taken from the previous article):
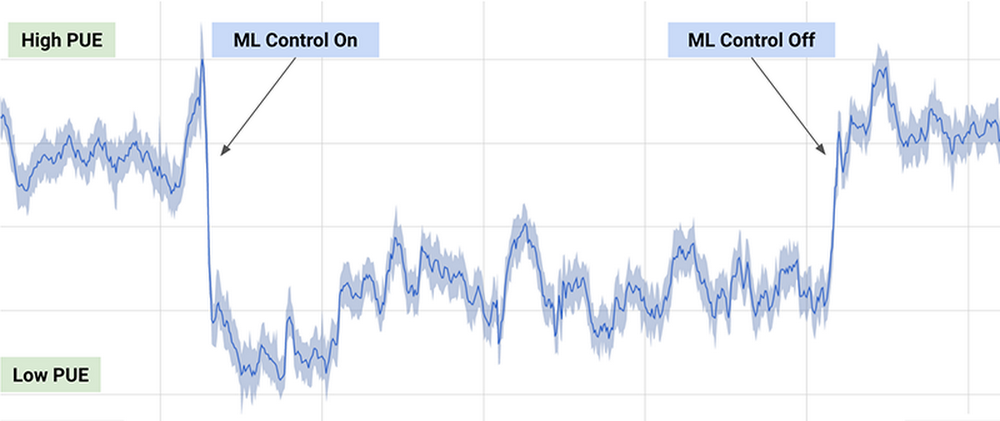
Figure 4 - Results of the DeepMind algorithm on the energy consumption of Google's data centers.
The algorithm employed uses a combination of deep learning and reinforcement learning techniques, together with a general purpose simulator to understand complex dynamic systems that could be applied in multiple environments such as transformation between energy types, water consumption or resource optimization in general.
Other possible applications in the public domain include the search and recommendation of open datasets through chatbots, or the optimization of public policies, as is the case of the European project Policy Cloud, applied for example in the analysis of future strategies of the different designations of origin of wines from Aragon.
In general, the application of this type of techniques could optimize the use of public resources by planning action policies that result in more sustainable consumption, reducing pollution, waste and public spending.
Content prepared by Jose Barranquero, expert in Data Science and Quantum Computing.
The contents and views expressed in this publication are the sole responsibility of the author.
Noticia
Autumn is coming to an end and, as every time we change season, we would like to summarize some of the main news and developments of the last three months.
One of the main advances of open data in our country has occurred in the legislative field, with the approval of the transposition of the European Directive on open data and reuse of public sector information. It has been included in the Royal Decree-Law 24/2021, validated last December 2 by the Congress. You can read about the new features here.
It is expected that, under the protection of this regulation, the Spanish open data ecosystem will continue to grow, as shown by the new developments in recent months. In the case of datos.gob.es, we have reached 160 public administrations publishing data this fall, exceeding 50,000 datasets accessible from the National Catalog. In addition, many organizations and reusers have launched new projects linked to open data, as we will see below.
La Palma volcano, an example of the value of public data
This autumn will be remembered in our country for the eruption of the volcano on the island of La Palma. A situation that has highlighted the importance of the publication and use of open data for the management of natural emergencies.
The open data portal of La Palma has offered -and offers- updated information about the eruption in Cumbre Vieja. Data on perimeters, photogrammetries, thermographs or terrain models can be consulted and downloaded from its website. In addition, the Cabildo Insular has created a unified point to collect all the information of interest in real time in a simple way. It is also important the data and tools made available to the public by the National Geographic Institute. In addition, the Copernicus Earth Observation Program offers data and maps of interest, as well as management support.
All these data have allowed the development of 3D viewers and tools to compare the situation prior to the eruption with the current one, which are very useful to understand the magnitude of the event and make decisions accordingly. The data have also been used by the media and reusers to create visuals to help transmit information to the public, such as this visual tour of the tongue of fire from the recording of the seismic activity to its arrival at the sea or this animation that shows in just 30 seconds, the 5,000 seismic movements recorded in La Palma to date.
Growing use of open data and new technologies
In addition to emergency management, open data is also increasingly being used by public agencies to improve the efficiency and effectiveness of their activities, often in conjunction with disruptive technologies such as artificial intelligence. Some examples are shown below:
- The Murcia City Council has announced that it is developing new sustainable mobility management models using data from the Copernicus Earth Observation Program. The information obtained will make it possible to offer new intelligent mobility services oriented to citizens, companies and public administrations of the municipality.
- Las Palmas de Gran Canaria has presented a Sustainable Tourism Intelligence System. It is a digital tool that provides updated data from multiple sources for decision-making and improving competitiveness, both for companies and for the tourist destination itself.
- The Vigo City Council plans to create a 3D model of the entire city, combining open data with geographic data. This action will be used to develop elements such as noise, pollution and traffic maps, among others.
- The Junta de Castilla y León is working on the Bision Project, a Business Intelligence system for better decision making in the field of health. The new system would automatically allow the development of instruments for evaluating the quality of the healthcare system. It is worth mentioning that the Junta de Castilla y León has received an award for the quality and innovation of its transparency portal during the pandemic thanks to its open data platform.
- The massive Artificial Intelligence system of the Spanish language MarIA, promoted by the State Secretariat for Digitalization and Artificial Intelligence, is making progress in its development. Based on the web archives of the Spanish National Library, a new version has been created that allows summarizing existing texts and creating new ones based on headlines or words.
What's new in open data platforms
In order to continue developing this type of projects, it is essential to continue promoting access to quality data and tools that facilitate their exploitation. In this regard, some of the new developments are:
- The Government of Navarra has presented a new portal in a conference at the University of Navarra, with the participation of the Aporta initiative. Cordoba, which has also approved the implementation of a new open data and transparency portal, will soon follow.
- Aragon's open data portal has released a new version of its API, the GA_OD_Core service. Its aim is to offer citizens and developers the ability to access the data offered on the portal and integrate them into different apps and services through REST architecture. In addition, Aragón has also presented a new virtual assistant that facilitates the location and access to data. It is a chatbot that provides answers based on the data it contains, with a conversational level that can be understood by the receiver.
- The Ministry of Transport, Mobility and Urban Agenda has published a viewer to consult the transport infrastructures belonging to the Trans-European Transport Network in Spain (TEN-T). The viewer allows the downloading of open data of the network, as well as projects co-financed with CEF funds.
- The Madrid City Council has presented Cibeles+, an artificial intelligence project to facilitate access to urban planning information. Using natural language processing techniques and machine learning, the system responds to complex urban planning questions and issues through Alexa and Twitter.
- The geoportal of the IDE Barcelona has launched a new open geographic data download service with free and open access. Among the information published in vector format, the topographic cartography (scale 1:1000) stands out. It includes urban and developable areas and sectors of interest in undeveloped land.
- The Valencia City Council has developed a data inventory to measure efficiency in the implementation of public policies. This tool will also allow citizens to access public information more quickly.
It should also be noted that the Pinto City Council has confirmed its adherence to the principles of the international Open Data Charter (ODC) with the commitment to improve open data policies and governance.
Boosting reuse and data-related capabilities
Public bodies have also launched various initiatives to promote the use of data. Among them, datos.gob.es launched at the end of November the fourth edition of the Aporta Challenge, focused on the field of health and welfare. This seeks to identify and recognize new ideas and prototypes that drive improvements in this field, using open data from public bodies.
This season we also met the winners of the V Open Data Contest organized by the Junta de Castilla y León. Of the 37 applications received, a jury of experts in the field has chosen 8 projects that have emerged as winners in the various categories.
Also, increasingly popular are the courses and seminars that are launched to increase the acquisition of data-related knowledge. Here are two examples:
- The City Council of L'Hospitalet de Llobregat has launched a training program on the use of data for municipal workers. This plan is structured in 22 different courses that will be taught until May next year.
- The Open Cities project has delivered a cycle of workshops related to open data in Smart cities. The complete video is available at this link.
Other news of interest in Europe
At the European level, we have ended the autumn with two major actions: the publication of the Open Data Maturity Index 2021, prepared by the European Data Portal, and the celebration of the EU Open Data Days. In the first one, it should be noted that Spain is in third position and is once again among the leading countries in open data in Europe. For its part, the EU Open Data Days were made up of the EU DataViz 2021 conference and the final of the EU Datathon 2021, where the Spanish company CleanSpot came second in its category. This app raises awareness and encourages recycling and reuse of products through gamification.
The European portal has also launched the Open Data Academy, with all available courses structured around four themes: policy, impact, technology and quality (the same as those assessed by the aforementioned maturity index). The curriculum is constantly updated with new materials.
Other new features include:
- The DCAT Application Profile for Data Portals in Europe (DCAT-AP) has been updated. The preliminary version of DCAT-AP version 2.1.0 was available for public review between October and November 2021.
- Asedie has been selected by the Global Data Barometer (GBD) and Access Info Europe, as "Country Researcher" for the elaboration of the 1st edition of the Global Data Barometer 20-21. This is a research project that analyses how data is managed, shared and used for the common good.
- The OpenCharts map catalog of European Centre for Medium-Range Weather Forecasts, which offers hundreds of open charts, has been updated. This RAM magazine article tells you what's new.
- The UK government has launched one of the world's first national standards for algorithmic transparency. This follows commitments made in its National Artificial Intelligence Strategy and its National Data Strategy.
Do you know of other examples of projects related to open data? Leave us a comment or write to dinamizacion@datos.gob.es.
Documentación
1. Introduction
Visualizations are a graphic representation that allow us to comprehend in a simple way the information that the data contains. Thanks to visual elements, such as graphs, maps or word clouds, visualizations also help to explain trends, patterns, or outliers that data may present.
Visualizations can be generated from the data of a different nature, such as words that compose a news, a book or a song. To make visualizations out of this kind of data, it is required that the machines, through software programs, are able to understand, interpret and recognize the words that form human speech (both written or spoken) in multiple languages. The field of studies focused on such data treatment is called Natural Language Processing (NLP). It is an interdisciplinary field that combines the powers of artificial intelligence, computational linguistics, and computer science. NLP-based systems have allowed great innovations such as Google's search engine, Amazon's voice assistant, automatic translators, sentiment analysis of different social networks or even spam detection in an email account.
In this practical exercise, we will apply a graphical visualization for a keywords summary representing various texts extracted with NLP techniques. Especially, we are going to create a word cloud that summarizes which are the most reoccurring terms in several posts of the portal.
This visualization is included within a series of practical exercises, in which open data available on the datos.gob.es portal is used. These address and describe in a simple way the steps necessary to obtain the data, perform transformations and analysis that are relevant to the creation of the visualization, with the maximum information extracted. In each of the practical exercises, simple code developments are used that will be conveniently documented, as well as free and open use tools. All the generated material will be available in the Data Lab repository on GitHub.
2. Objetives
The main objective of this post is to learn how to create a visualization that includes images, generated from sets of words representative of various texts, popularly known as \"word clouds\". For this practical exercise we have chosen 6 posts published in the blog section of the datos.gob.es portal. From these texts using NLP techniques we will generate a word cloud for each text that will allow us to detect in a simple and visual way the frequency and importance of each word, facilitating the identification of the keywords and the main theme of each of the posts.
From a text we build a cloud of words applying Natural Language Processing (NLP) techniques
3. Resources
3.1. Tools
To perform the pre-treatment of the data (work environment, programming and the very edition), such as the visualization itself, Python (versión 3.7) and Jupyter Notebook (versión 6.1) are used, tools that you will find integrated in, along with many others in Anaconda, one of the most popular platforms to install, update and manage software to work in data science. To tackle tasks related to Natural Language Processing, we use two libraries, Scikit-Learn (sklearn) and wordcloud. All these tools are open source and available for free..
Scikit-Learn is a very popular vast library, designed in the first place to carry out machine learning tasks on data in textual form. Among others, it has algorithms to perform classification, regression, clustering, and dimensionality reduction tasks. In addition, it is designed for deep learning on textual data, being useful for handling textual feature sets in the form of matrices, performing tasks such as calculating similarities, classifying text and clustering. In Python, to perform this type of tasks, it is also possible to work with other equally popular libraries such as NLTK or spacy, among others.
wordcloud eis a library specialized in creating word clouds using a simple algorithm that can be easily modified.
To facilitate understanding for readers not specialized in programming, the Python code included below, accessible by clicking on the \"Code\" button in each section, is not designed to maximize its efficiency, but to facilitate its comprehension, therefore it is likely that readers more advanced in this language may consider more efficient, alternative ways to code some functionalities. The reader will be able to reproduce this analysis if desired, as the source code is available on datos.gob.es's GitHub account. The way the code is provided is through a Jupyter Notebook, which once loaded into the development environment can be easily executed or modified if desired.
3.2. Datasets
For this analysis, 6 posts recently published on the open data portal datos.gob.es, in its blog section, have been selected. These posts are related to different topics related to open data:
- The latest news in natural language processing: summaries of classic works in just a few hundred words.
- The importance of anonymization and data privacy.
- The value of real-time data through a practical example.
- New initiatives to open and harness data for health research.
- Kaggle and other alternative platforms for learning data science.
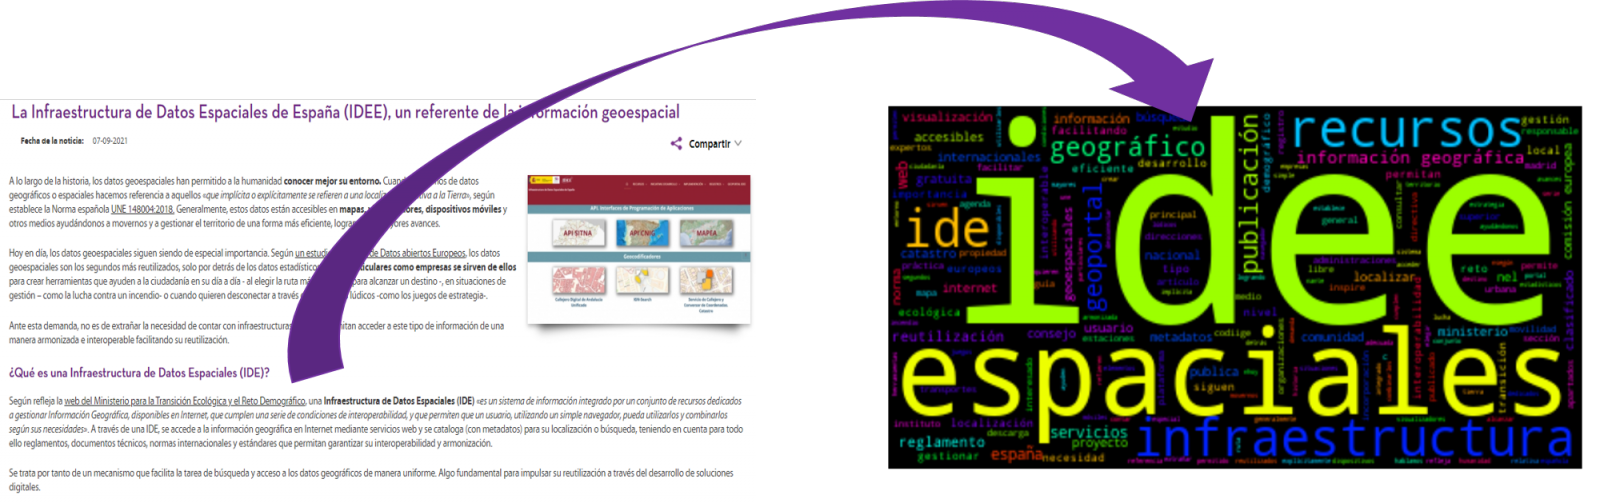
- The Spatial Data Infrastructure of Spain (IDEE), a benchmark for geospatial information.
4. Data processing
Before advancing to creation of an effective visualization, we must perform a preliminary data treatment or pre-processing of the data, paying attention to obtaining them, ensuring that they do not contain errors and are in a suitable format for processing. Data pre-processing is essential for build any effective and consistent visual representation.
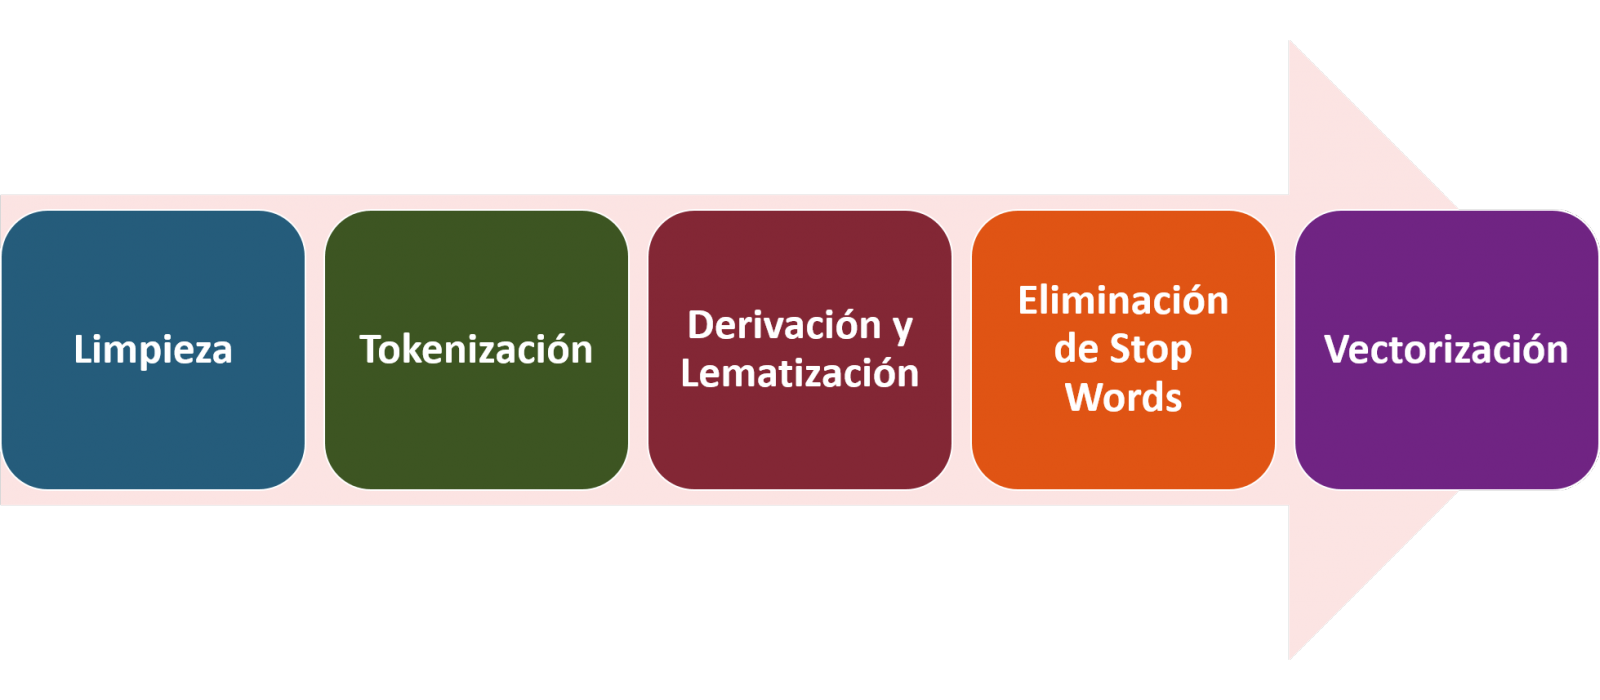
In NLP, the pre-processing of the data consists mainly of a series of transformations that are carried out on the input data, in our case several posts in TXT format, with the aim of obtaining standardized data and without elements that may affect the quality of the results, in order to facilitate its subsequent processing to perform tasks such as, generate a word cloud, perform opinion/sentiment mining or generate automated summaries from input texts. In general, the flowchart to be followed to perform word preprocessing includes the following steps:
- Cleaning: Removal of special characters and symbols that inflict results distortion, such as punctuation marks.
- Tokenize: Tokenization is the process of separating a text into smaller units, tokens. Tokens can be sentences, words, or even characters.
- Derivation and Lemmatisation: this process consists of transforming words to their basic form, that is, to their canonical form or lemma, eliminating plurals, verb tenses or genders. This action is sometimes redundant since it is not always required for further processing to know the semantic similarity between the different words of the text.
- Elimination of stop words: stop words or empty words are those words of common use that do not contribute in a significant way to the text. These words should be removed before text processing as they do not provide any unique information that can be used for the classification or grouping of the text, for example, determining articles such as 'a', 'an', 'the' etc.
- Vectorization: in this step we transform each of the tokens obtained in the previous step to a vector of real numbers that is generated based on the frequency of the appearance of each word in the text. Vectorization allows machines to be able to process text and apply, among others, machine learning techniques.
4.1. Installation and loading of libraries
Before starting with data pre-processing, we need to import the libraries to work with. Python provides a vast number of libraries that allow to implement functionalities for many tasks, such as data visualization, Machine Learning, Deep Learning or Natural Language Processing, among many others. The libraries that we will use for this analysis and visualization are the following:
- os, which allows access to operating system-dependent functionality, such as manipulating the directory structure.
- re, provides functions for processing regular expressions.
- pandas, is a very popular and essential library for processing data tables.
- string, provides a series of very useful functions for handling strings.
- matplotlib.pyplot, contains a collection of functions that will allow us to generate the graphical representations of the word clouds.
- sklearn.feature_extraction.text (Scikit-Learn library), converts a collection of text documents into a vector array. From this library we will use some commands that we will discuss later.
- wordcloud, library with which we can generate the word cloud.
# Importaremos las librerías necesarias para realizar este análisis y la visualización. import os import re import pandas as pd import string import matplotlib.pyplot as plt from sklearn.feature_extraction.text import CountVectorizer from sklearn.feature_extraction.text import TfidfTransformer from wordcloud import WordCloud4.2. Data loading
Once the libraries are loaded, we prepare the data with which we are going to work. Before starting to load the data, in the working directory we need: (a) a folder called \"post\" that will contain all the files in TXT format with which we are going to work and that are available in the repository of this project of the GitHub of datos.gob.es; (b) a file called \"stop_words_spanish.txt\" that contains the list of stop words in Spanish, which is also available in said repository and (c) a folder called \"images\" where we will save the images of the word clouds in PNG format, which we will create below.
# Generamos la carpeta \"imagenes\".nueva_carpeta = \"imagenes/\" try: os.mkdir(nueva_carpeta)except OSError: print (\"Ya existe una carpeta llamada %s\" % nueva_carpeta)else: print (\"Se ha creado la carpeta: %s\" % nueva_carpeta)Next, we will proceed to load the data. The input data, as we have already mentioned, are in TXT files and each file contains a post. As we want to perform the analysis and visualization of several posts at the same time, we will load in our development environment all the texts that interest us, to later insert them in a single table or dataframe.
# Generamos una lista donde incluiremos todos los archivos que debe leer, indicándole la carpeta donde se encuentran.filePath = []for file in os.listdir(\"./post/\"): filePath.append(os.path.join(\"./post/\", file))# Generamos un dataframe en el cual incluiremos una fila por cada post.post_df = pd.DataFrame()for file in filePath: with open (file, \"rb\") as readFile: post_df = pd.DataFrame([readFile.read().decode(\"utf8\")], append(post_df)# Nombramos la columna que contiene los textos en el dataframe.post_df.columns = [\"texto\"]4.3. Data pre-processing
In order to obtain our objective: generate word clouds for each post, we will perform the following pre-processing tasks.
a) Data cleansing
Once a table containing the texts with which we are going to work has been generated, we must eliminate the noise beyond the text that interests us: special characters, punctuation marks and carriage returns.
First, we put all characters in lowercase to avoid any errors in case-sensitive processes, by using the lower() command.
Then we eliminate punctuation marks, such as periods, commas, exclamations, questions, among many others. For the elimination of these we will resort to the preinitialized string.punctuacion of the string library, which returns a set of symbols considered punctuation marks. In addition, we must eliminate tabs, cart jumps and extra spaces, which do not provide information in this analysis, using regular expressions.
It is essential to apply all these steps in a single function so that they are processed sequentially, because all processes are highly related.
# Eliminamos los signos de puntuación, los saltos de carro/tabulaciones y espacios en blanco extra.# Para ello generamos una función en la cual indicamos todos los cambios que queremos aplicar al texto.def limpiar_texto(texto): texto = texto.lower() texto = re.sub(\"\\[.*?¿\\]\\%\", \" \", texto) texto = re.sub(\"[%s]\" % re.escape(string.punctuation), \" \", texto) texto re.sub(\"\\w*\\d\\w*\", \" \", texto) return texto# Aplicamos los cambios al texto.limpiar_texto = lambda x: limpiar_texto(x)post_clean = pd.DataFrame(post_clean.texto.apply/limpiar_texto)b) Tokenize
Once we have eliminated the noise in the texts with which we are going to work, we will tokenize each of the texts in words. For this we will use the split() function, using space as a separator between words. This will allow separating the words independently (tokens) for future analysis.
# Tokenizar los textos. Se crea una nueva columna en la tabla con los tokens con el texto \"tokenizado\".def tokenizar(text): text = texto.split(sep = \" \") return(text)post_df[\"texto_tokenizado\"] = post_df[\"texto\"].apply(lambda x: tokenizar(x))c) Removal of \"stop words\"
After removing punctuation marks and other elements that can distort the target display, we will remove \"stop words\". To carry out this step we use a list of Spanish stop words since each language has its own list. This list consists of a total of 608 words, which include articles, prepositions, linking verbs, adverbs, among others and is recently updated. This list can be downloaded from the datos.gob.es GitHub account in TXT format and must be located in the working directory.
# Leemos el archivo que contiene las palabras vacías en castellano.with open \"stop_words_spanish.txt\", encoding = \"UTF8\") as f: lines = f.read().splitlines()In this list of words, we will include new words that do not contribute relevant information to our texts or appear recurrently due to their own context. In this case, there is a bunch of words, which we should eliminate since they are present in all posts repetitively since they all deal with the subject of open data and there is a high probability that these are the most significant words. Some of these words are, \"item\", \"data\", \"open\", \"case\", among others. This will allow to obtain a more representative graphic representation of the content of each post.
On the other hand, a visual inspection of the results obtained allows to detect words or characters derived from errors included in the texts, which obviously have no meaning and that have not been eliminated in the previous steps. These should be removed from the analysis so that they do not distort the subsequent results. These are words like, \"nen\", \"nun\" or \"nla\"
# Actualizamos nuestra lista de stop words.stop_words.extend((\"caso\", \"forma\",\"unido\", \"abiertos\", \"post\", \"espera\", \"datos\", \"dato\", \"servicio\", \"nun\", \"día\", \"nen\", \"data\", \"conjuntos\", \"importantes\", \"unido\", \"unión\", \"nla\", \"r\", \"n\"))# Eliminamos las stop words de nuestra tabla.post_clean = post_clean [~(post_clean[\"texto_tokenizado\"].isin(stop_words))]d) Vectorization
Machines are not capable of understanding words and sentences therefore, they must be transformed to some numerical structure. The method consists of generating vectors from each token. In this post we use a simple technique known as bag-of-words (BoW). It consists of assigning a weight to each token proportional to the frequency of appearance of that token in the text. To do this, we work on an array in which each row represents a text and each column a token. To perform the vectorization we will resort to the CountVectorizer() and TfidTransformer() commands of the scikit-learn library.
The CountVectorizer() function allows you to transform text into a vector of frequencies or word counts. In this case we will obtain 6 vectors with as many dimensions as there are tokens in each text, one for each post, which we will integrate into a single matrix, where the columns will be the tokens or words and the rows will be the posts.
# Calculamos la matriz de frecuencia de palabras del texto.vectorizador = CountVectorizer()post_vec = vectorizador.fit_transform(post_clean.texto_tokenizado)Once the word frequency matrix is generated, it is necessary to convert it into a normalized vector form in order to reduce the impact of tokens that occur very frequently in the text. To do this we will use the TfidfTransformer() function.
# Convertimos una matriz de frecuencia de palabras en una forma vectorial regularizada.transformer = TfidfTransformer()post_trans = transformer.fit_transform(post_vec).toarray()If you want to know more about the importance of applying this technique, you will find numerous articles on the Internet that talk about it and how relevant it is, among other issues, for SEO optimization.
5. Creation of the word cloud
Once we have concluded the pre-processing of the text, as we indicated at the beginning of the post, it is possible to perform NLP tasks. In this exercise we will create a word cloud or \"WordCloud\" for each of the analyzed texts.
A word cloud is a visual representation of the words with the highest rate of occurrence in the text. It allows to detect in a simple way the frequency and importance of each of the words, facilitating the identification of the keywords and discovering with a single glance the main theme treated in the text.
For this we are going to use the \"wordcloud\" library that incorporates the necessary functions to build each representation. First, we have to indicate the characteristics that each word cloud should present, such as the background color (background_color function), the color map that the words will take (colormap function), the maximum font size (max_font_size function) or set a seed so that the word cloud generated is always the same (function random_state) in future implementations. We can apply these and many other functions to customize each word cloud.
# Indicamos las características que presentará cada nube de palabras.wc = WordCloud(stopwords = stop_words, background_color = \"black\", colormap = \"hsv\", max_font_size = 150, random_state = 123)Once we have indicated the characteristics that we want each word cloud to present, we proceed to create it and save it as an image in PNG format. To generate the word cloud, we will use a loop in which we will indicate different functions of the matplotlib library (represented by the plt prefix) necessary to graphically generate the word cloud according to the specification defined in the previous step. We have to specify that a world cloud needs to be created for each row of the table, that is, for each text, with the function plt.subplot(). With the command plt.imshow() we indicate that the result is a 2D image. If we want the axes not to be displayed, we must indicate it with the plt.axis() function. Finally, with the function plt.savefig() we will save the generated visualization.
# Generamos las nubes de palabras para cada uno de los posts.for index, i in enumerate(post.columns): wc.generate(post.texto_tokenizado[i]) plt.subplot(3, 2, index+1 plt.imshow(wc, interpolation = \"bilinear\") plt.axis(\"off\") plt.savefig(\"imagenes/.png\")# Mostramos las nubes de palabras resultantes.plt.show()The visualization obtained is:
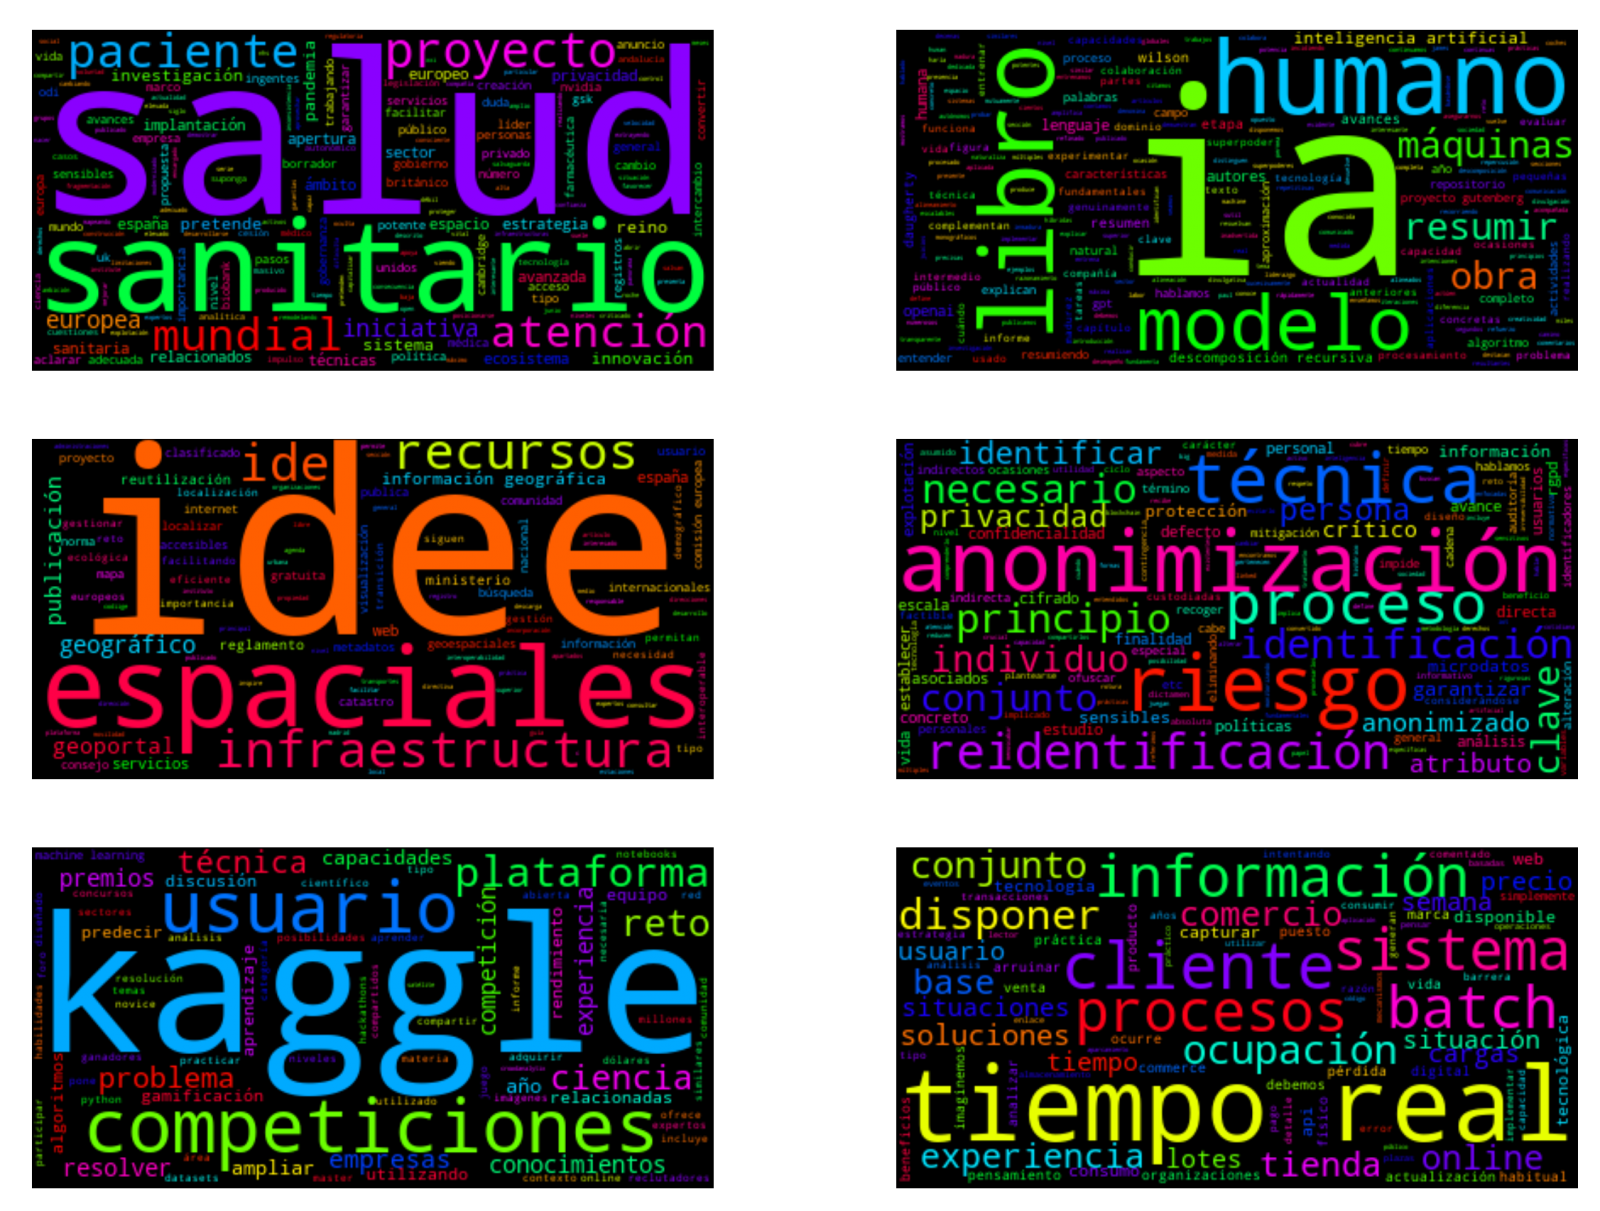
Visualization of the word clouds obtained from the texts of different posts of the blog section of datos.gob.es
5. Conclusions
Data visualization is one of the most powerful mechanisms for exploiting and analyzing the implicit meaning of data, regardless of the data type and the degree of technological knowledge of the user. Visualizations allow us to extract meaning out of the data and create narratives based on graphical representation.
Word clouds are a tool that allows us to speed up the analysis of textual data, since through them we can quickly and easily identify and interpret the words with the greatest relevance in the analyzed text, which gives us an idea of the subject.
If you want to learn more about Natural Language Processing, you can consult the guide \"Emerging Technologies and Open Data: Natural Language Processing\" and the posts \"Natural Language Processing\" and \" The latest news in natural language processing: summaries of classic works in just a few hundred words\".
Hopefully this step-by-step visualization has taught you a few things about the ins and outs of Natural Language Processing and word cloud creation. We will return to show you new data reuses. See you soon!
Evento
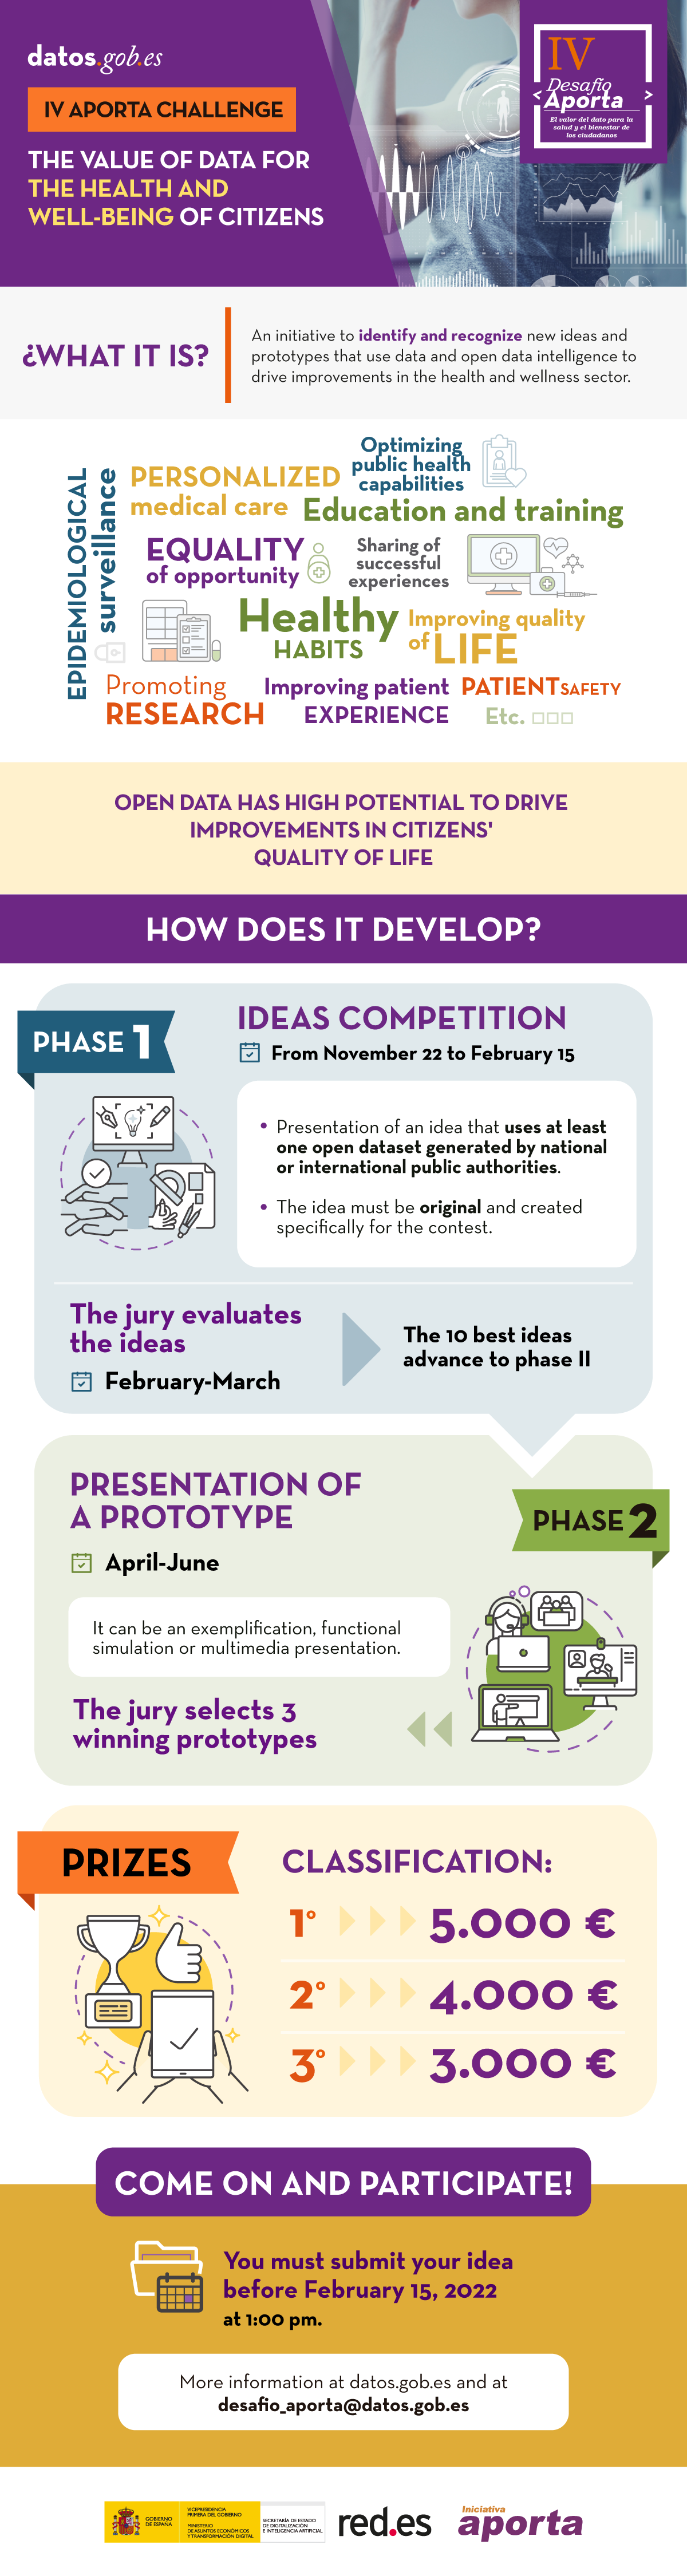
Red.es, in collaboration with the Secretary of State for Digitalization and Artificial Intelligence, organizes the fourth edition of the Aporta Challenge. Like other years, it seeks to identify and recognize new ideas and prototypes that drive improvements in a specific sector through the use of open data. This year the focus will be on health and wellness.
The objective is to encourage the talent, technical competence and creativity of the participants while promoting the direct reuse of data published by various public bodies.
Why is it important to promote the use of open data in the health and wellness sector?
If there is one sector where there has been a demand for data in the last year, it has been healthcare, due in part to the global COVID-19 pandemic. However, open data related to health and well-being not only serves to inform citizens in an exercise of transparency, but is also essential as a basis for solutions that drive improvements in health care, the patient experience and services that are offered in order to ensure a better quality of life. Open data has the ability to make essential public services more efficient, effective and inclusive, which in turn contributes to reducing inequality.
Aware of this, the European Commission has among its priorities the creation of a European data space in the health sector. For its part, the Spanish Government has begun actions to establish a data lake sanitary- which will make a large amount of raw data available to researchers so they can analyze it, make predictions, or spot trends. The use of this data, anonymised or in an aggregated form, can generate great improvements that some autonomies are already taking advantage of, such as Andalusia, that works, with the collaboration of Red.es, in the implementation of an advanced analytics system based on Big Data technologies to improve the quality of life of chronic patients.
Under the slogan "The value of data for the health and well-being of citizens" an open competition will be held which, like other years, will consist of two phases:
Phase I: Ideas competition. From 22/11/2021 to 15/02/2022
Participants must present an idea that responds to the proposed challenge: it is about identifying new opportunities to capture, analyze and use data intelligence to drive improvements related to health and well-being.
Proposals must be based on the use of at least one set of open data generated by Public Administrations, whether national or international. These data may be combined with others of a public or private nature.
The idea presented must be original and not have been awarded previously. Previously existing solutions are not valid, but must be developed by the participant within the framework of the Challenge.
A jury made up of experts in the field will assess the ideas presented and will choose 10, which go on to phase II. The criteria that will be taken into account for the evaluation are:
- Relevance
- Quality and overall clarity of the proposed idea
- Impact on the improvement of the educational system of the proposed idea
- Data sources used
- Promotion of the quality of life of vulnerable groups
Phase II: Prototype development and face-to-face exhibition. April-June.
The participants whose ideas have been selected in the previous phase will develop the associated prototype and present it to the members of the Jury. For this they will have a period of 4 months.
The prototypes may be a functional solution, a visualization, dynamic graphic element or multimedia solution that simulates the service or a functional exemplification from the extrapolation of an existing solution, for example, in another sector, country, area, etc.
In this case, the evaluation criteria will be:
- Easy to use
- Technical quality of the prototype
- Viability
- Exhibition quality
The three proposals with the highest score will be the winners and will receive the following financial award:
- First classified: € 5,000
- Second classified: € 4,000
- Third classified: € 3,000
Examples of challenges to solve
Algunos ejemplos de retos a los que pueden dar respuesta las soluciones presentadas son:
- Promote the acquisition and consolidation of healthy habits in citizenship
- Get more effective medical care and improve the patient experience
- Increase public health and epidemiological surveillance capacities
- Obtain better health and wellness outcomes for the dependent, chronically ill, or elderly
- Ensure that all people have the maximum opportunity to preserve their health and well-being
- Optimize the training and development of healthcare professionals
- Promote research to help discover healthy patterns and new treatments
- Encourage the sharing of successful experiences
- Leverage data to improve patient and service user safety
Who can participate?
Registration is open to any person, team or company domiciled in the European Union, who wants to contribute to economic and social development in the field of health and well-being.
How can I sign up?
You can register through the red.es electronic area. For this you will need your password or electronic certificate. The deadline ends on February 15, 2022 at 1:00 p.m.
You must include a detailed description of your idea and its value to society, as well as a descriptive video of the idea in Spanish, between 120 and 180 seconds long.
You have all the information at red.es and the bases of the Challenge.
Get inspired by the finalist works from previous editions!
For inspiration, look at work from previous years.
- III Challenge Aporta: "The value of data in digital education"
- II Challenge Aporta: "The value of data for the agri-food, forestry and rural sectors"
- I Challenge Provides: "The value of data for the Administration"
Go ahead and participate!
If you would like to help spread this information to others, we offer materials (in Spanish) that will make it easier for you:
Noticia
On November 2, the awards ceremony took place for the winners of the V edition of the Castilla y León Open Data Contest. This competition, organized by the Ministry of Transparency, Spatial Planning and Foreign Action of the Junta de Castilla y León, recognizes the realization of projects that provide ideas, studies, services, websites or mobile applications, using for this datasets from this Open Data Portal.
The event had the participation of Francisco Igea, Vice President of the Junta de Castilla y León, and Joaquín Meseguer, General Director of Transparency and Good Governance of the same, in charge of awarding the awards to the winners.
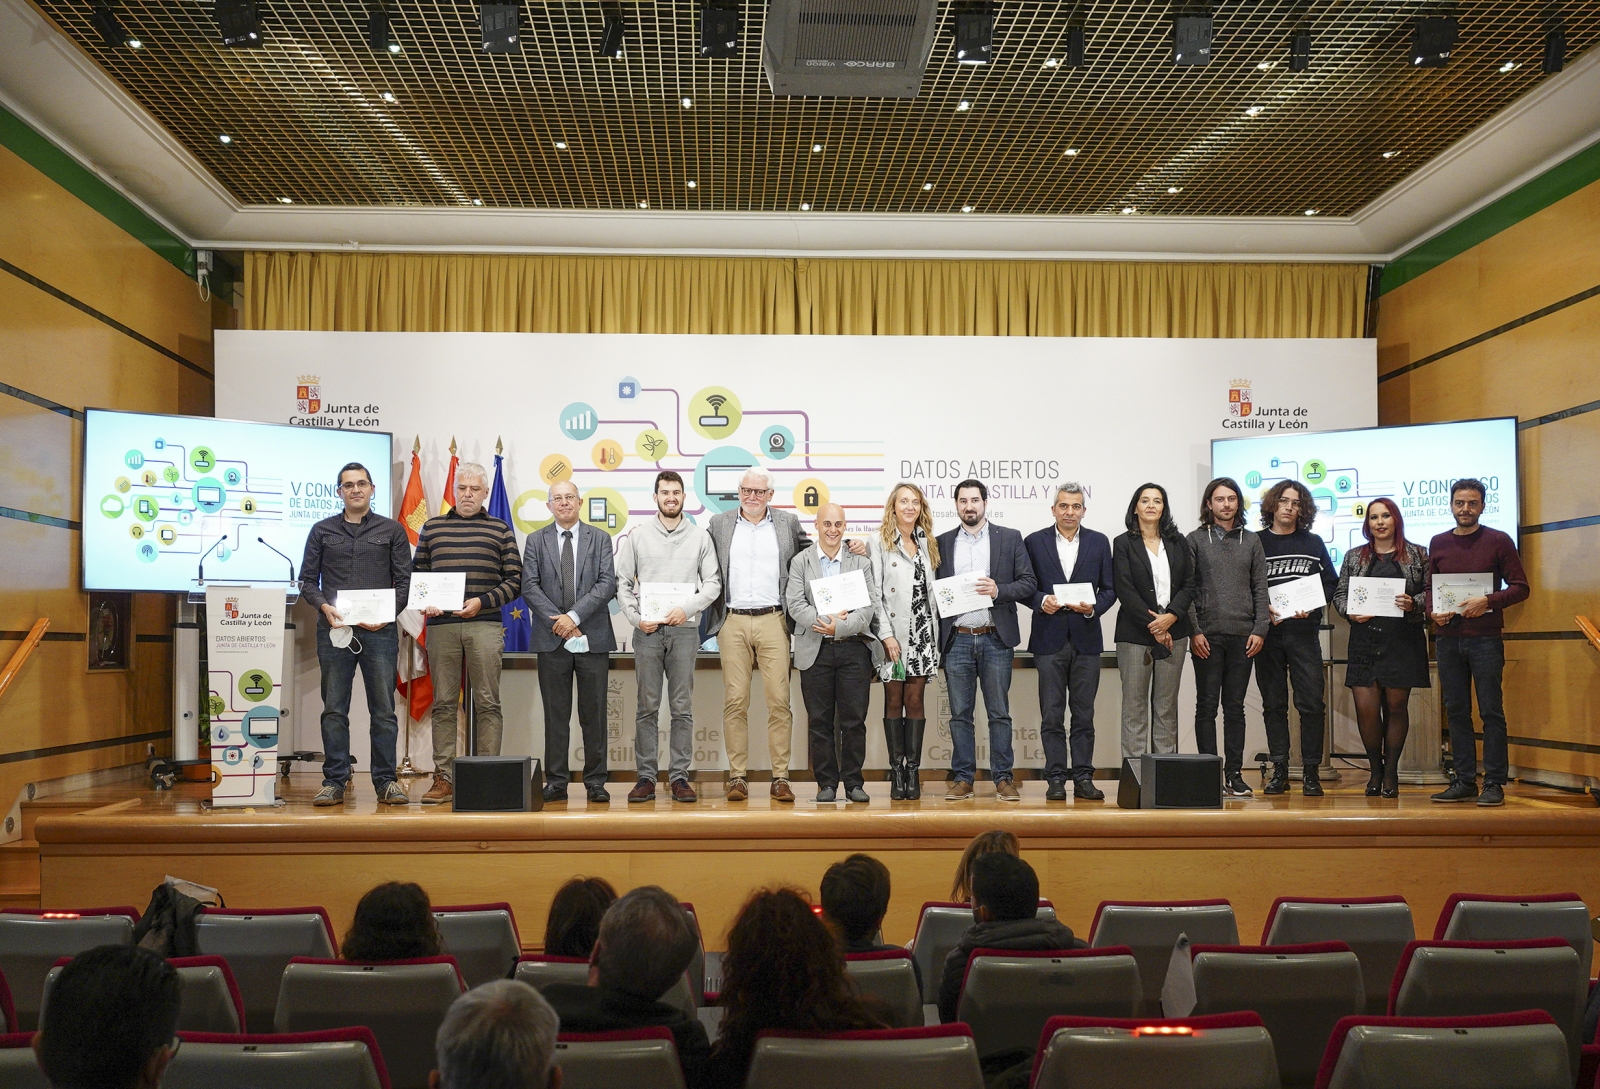
Of the 37 applications received, a jury of experts in the field has chosen 8 projects that have emerged as winners in the various categories.
Category Ideas
In this category, proposals to develop studies, services, websites or applications for mobile devices are awarded.
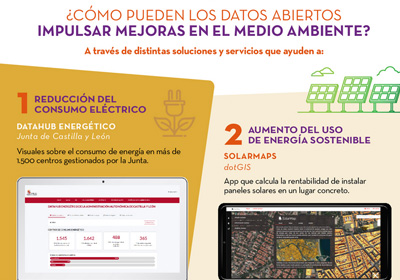
- The first prize, € 1,500, went to APP SOLAR-CYL, a web tool for optimal sizing of photovoltaic solar self-consumption installations. Aimed at both citizens and energy managers of the Public Administration, the solution seeks to support the analysis of the technical and economic viability of this type of system. The idea was presented by professors from the Electrical Engineering Area, members of the ERESMA (Energy Resources' Smart Management) research group at the University of León: Miguel de Simón Martín, Ana María Díez Suárez, Alberto González Martínez, Álvaro de la Puente Gil and Jorge Blanes Peiró.
- The second prize, € 500, went to Dónde te esperan: Recommender for municipalities in Spain, by Mario Varona Bueno. Thanks to this tool, users will be able to find the best place to live based on their preferences or even chance.
Category Products and Services
This category differs from the previous one in that ideas are no longer awarded, but projects accessible to all citizens via the web through a URL.
- Repuéblame won the first prize, which this time consisted of € 2,500. Presented by Guido García Bernardo and Javier García Bernardo, it consists of a website to rediscover the best places to live or telework. The application catalogs the Castilian-Leon municipalities based on a series of numerical indicators, of its own creation, related to quality of life.
- The second prize, € 1,500, went to Plagrícola: Avisos de Plagas Agrícolas CyL by José María Pérez Ramos. It is a mobile app that informs farmers of the pest alerts published by the Instituto Tecnológico Agrario de Castilla y León (Itacyl), so that they can carry out the necessary preventive and curative measures.
- Complete the podium disCAPACIDAD.es [web], which won the third prize of € 500. Its creator, Luis Hernández Fuentevilla, has developed a website that centralizes offers and aid related to employment for people with disabilities in Castilla y León.
- This category also included a prize for students of €1,500. The winner was Ruta x Ruta x Castilla y León, presented by Adrián Arroyo Calle. This web application allows users to consult routes of all kinds, as well as points of interest located in their vicinity, such as monuments, restaurants or events. The solution also allows users to share their tracks (GPS recordings).
In addition, an honorable mention has been given to the candidatures presented by students "APP BOCYL Boletín Oficial Castilla y León”, by Nicolás Silva Brenes and "COVID CyL" presented by Silvia Pedrón Hermosa. This seeks to encourage students to work with data and present their projects to future calls.
Data Journalism Category
This category is designed to reward relevant journalistic pieces published or updated in any medium, whether written or audiovisual.
- MAPA COVID-19: check how many cases of coronavirus there are and how is the occupation of your hospital from the Maldita Association against misinformation won the first prize of € 1,500. After a work of compiling all the available data that the regional governments publish about the hospitals, Maldita has created a map to see how many cases of coronavirus there are and how the different hospitals are occupied. Information on ICU occupancy is also included in some hospitals.
- The second prize, € 1,000, went to De cero a 48.000 euros: who charges how much in the mayors of Castilla y León. Annual Compensation Explorer. Through various visualizations, its creator, Laura Navarro Soler, reveals information available in the Información Salarial Puestos de la Administración (ISPA). This information is crossed with other types of data such as the number of inhabitants in each region or the level of dedication (exclusive, partial or non-dedicated).
The category "Didactic Resource" has been declared void. The jury considered that the candidatures presented did not meet the criteria set out in the bases.
In total, the 8 awarded projects have received 12,000 euros. They will also have the option of participating in a business development consultancy.
Congratulations to all the winners!
Documentación
These infographics show examples of the use of open data in certain sectors, as well as data from studies on its impact. New content will be published periodically.
Learning with open data: training resources for secondary school students
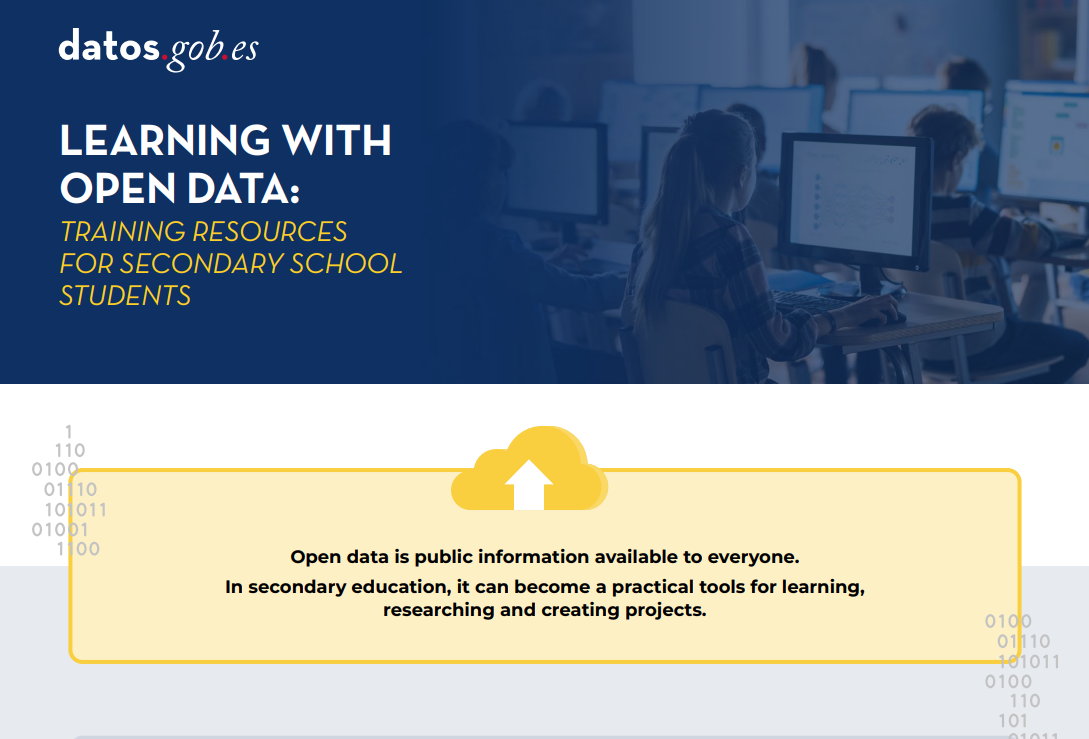 |
Published: November 2025 This compilation of educational resources serves as a guide to learning more about open data and related technologies. Specially designed for students, it compiles tips for harnessing the potential of data sets, videos, and much more. |
Open science and citizen science: the combination that transforms research
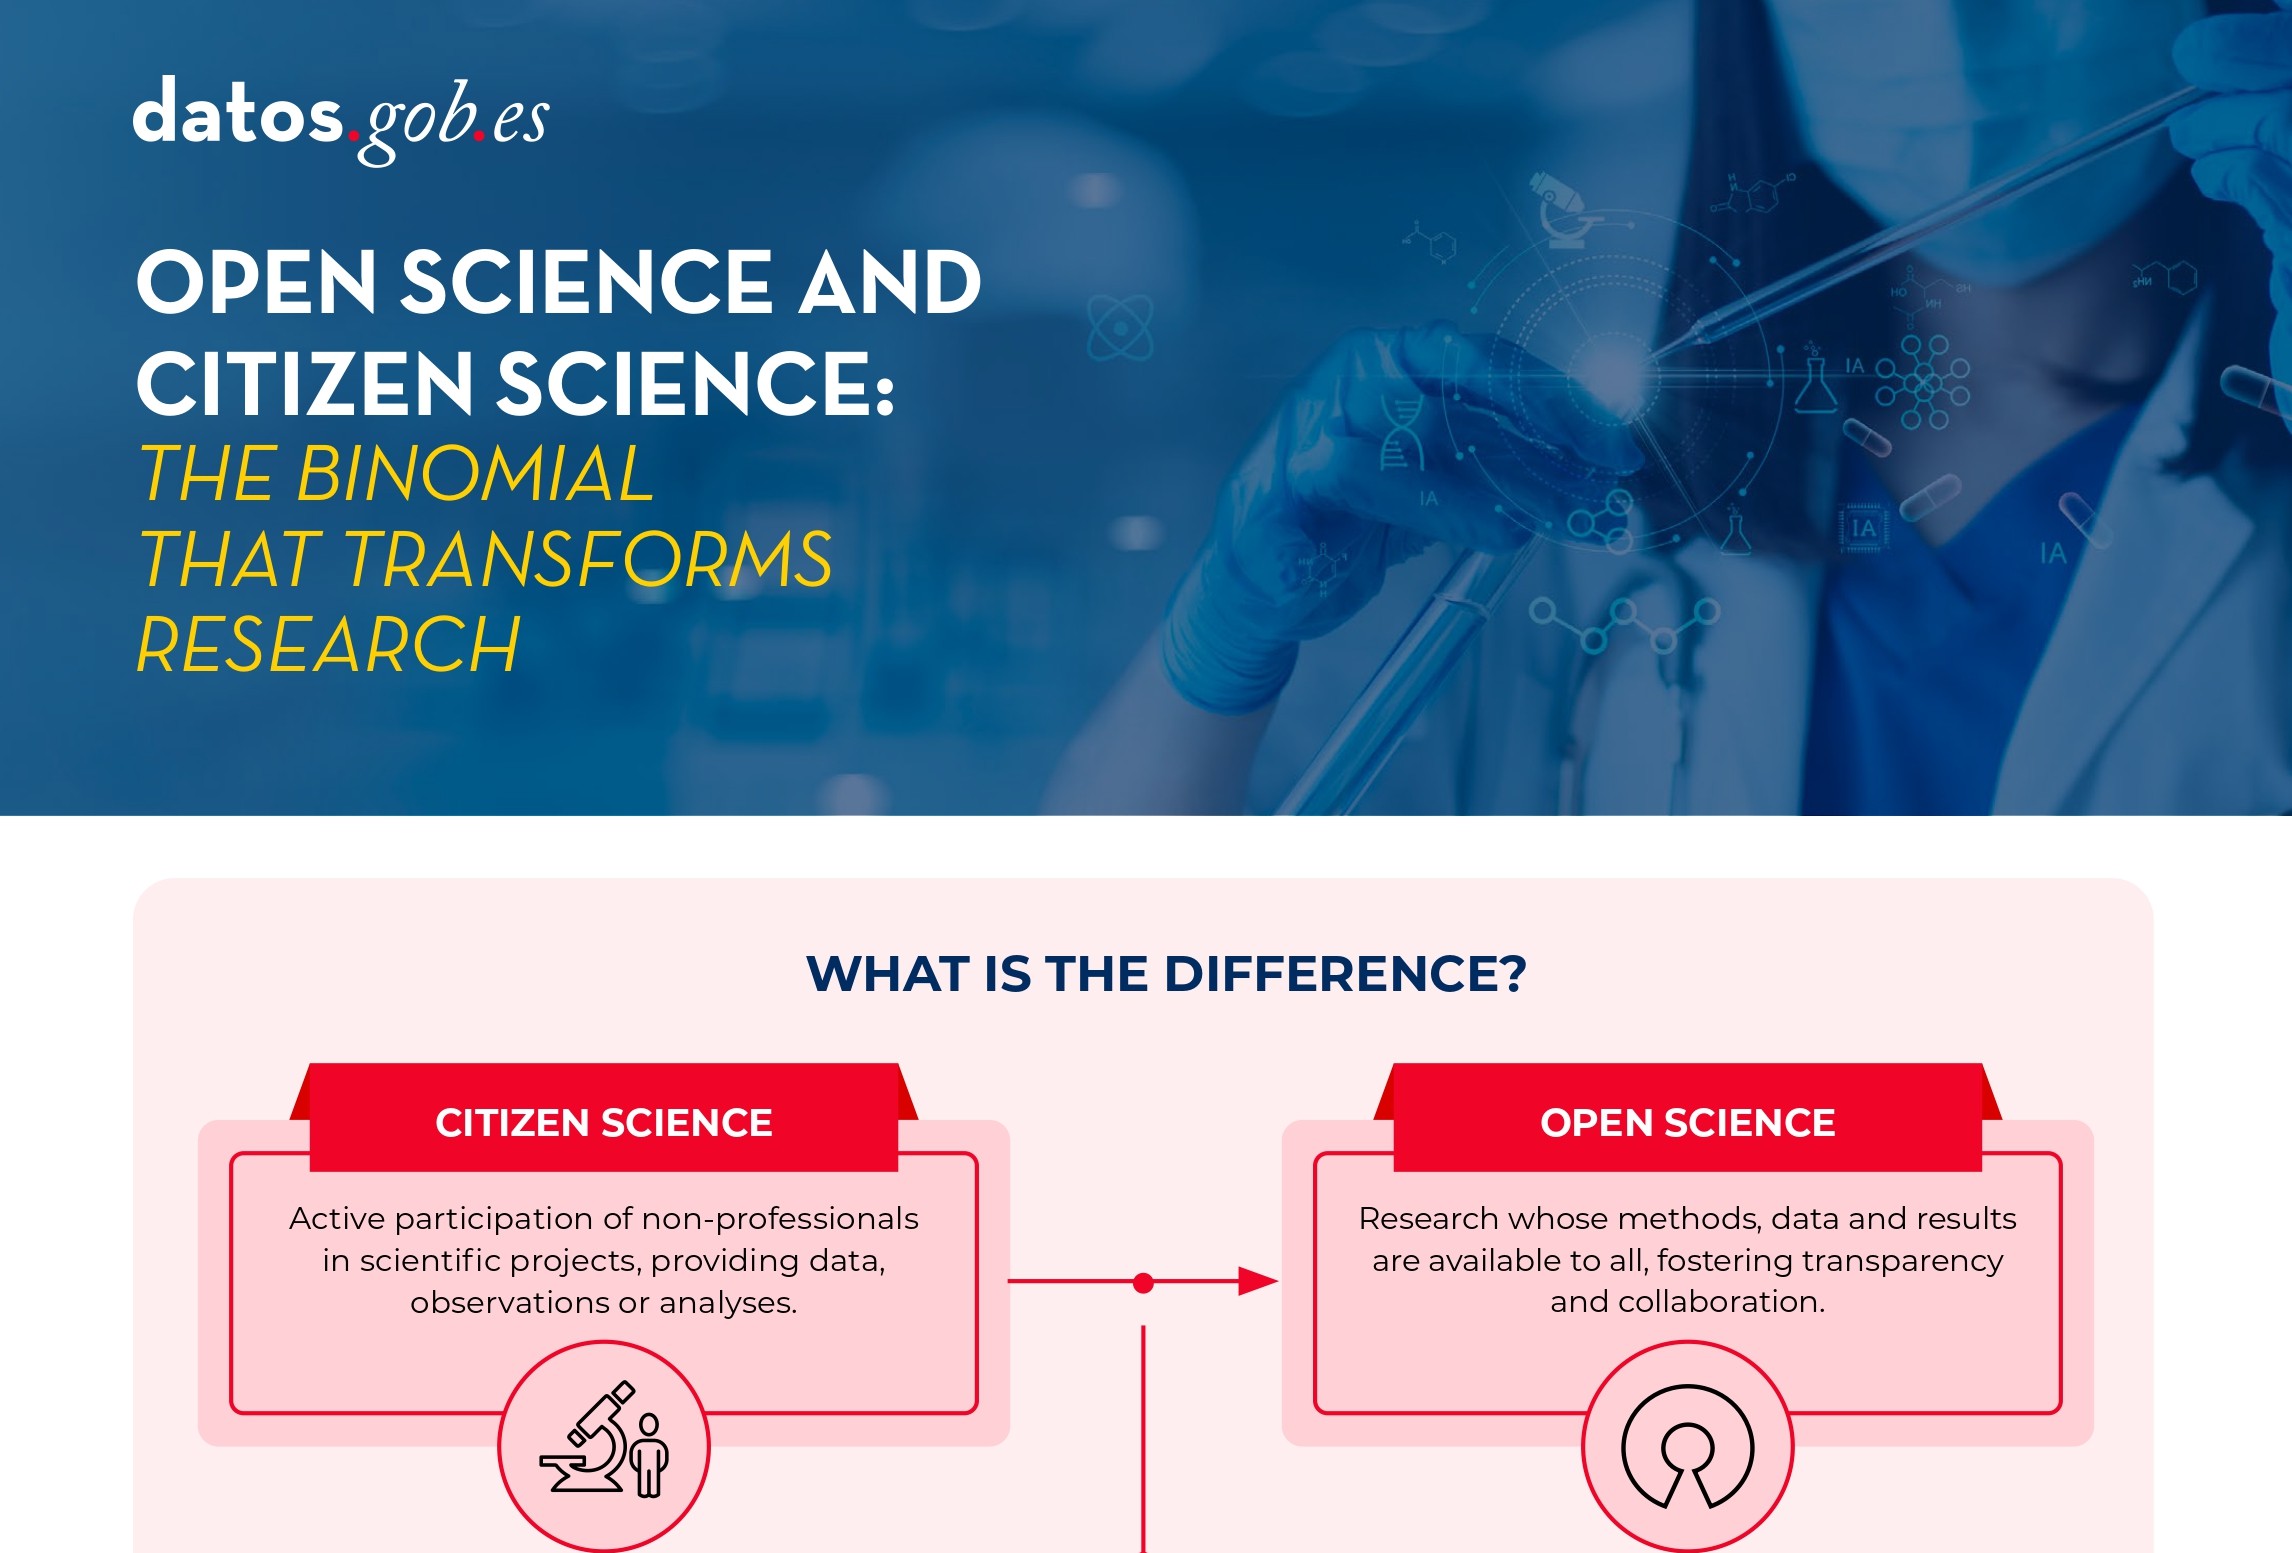 |
Published: July 2025 Planning the publication of open data from the outset of a citizen science project is key to ensuring the quality and interoperability of the data generated, facilitating its reuse, and maximizing the scientific and social impact of the project. |
Open Data and Urban Management: Innovative Use Cases
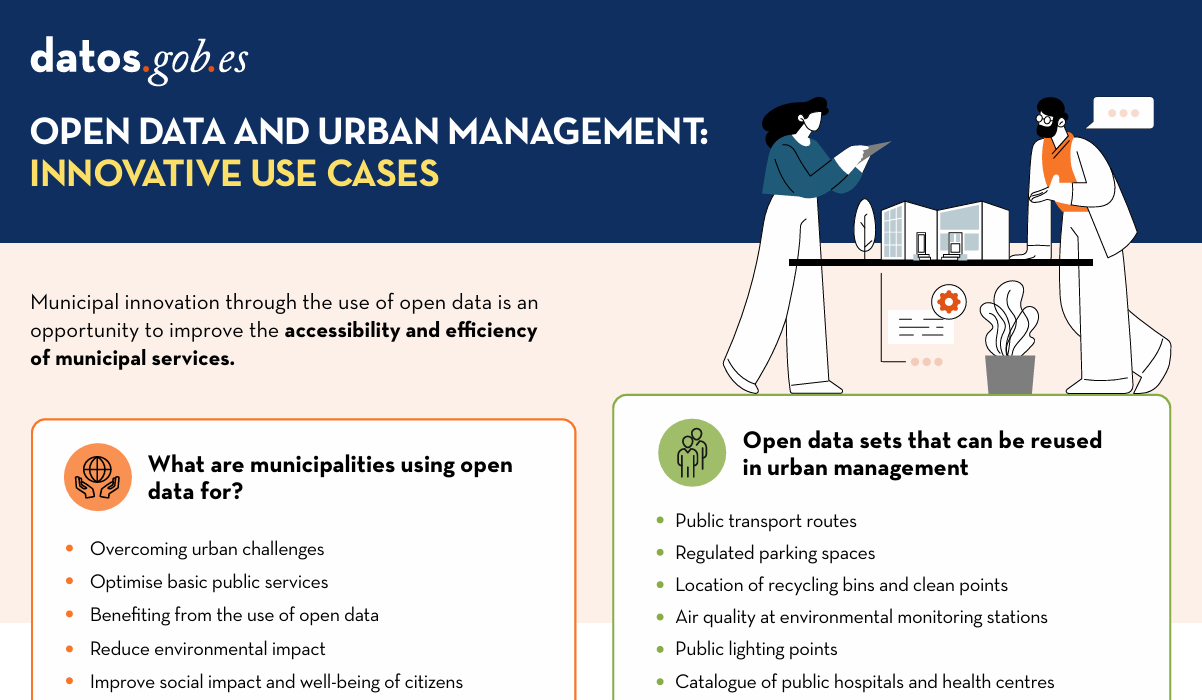 |
Published: July 2024 Municipal innovation through the use of open data presents a significant opportunity to improve the accessibility and efficiency of municipal services. In this infographic, we collect examples of applications that contribute to the improvement of urban sectors such as transport and mobility, organisation of basic public services, environment and sustainability, and citizen services. |
Open data for Sustainable City Development
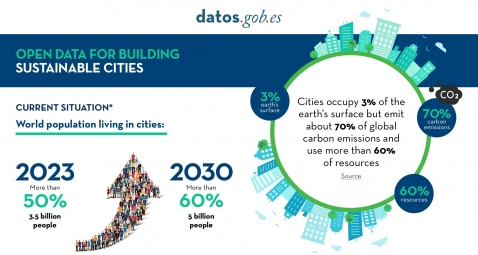 |
Published: August 2023 In this infographic, we have gathered use cases that utilize sets of open data to monitor and/or enhance energy efficiency, transportation and urban mobility, air quality, and noise levels. Issues that contribute to the proper functioning of urban centers. |
Open data, a key tool for promoting knowledge and education
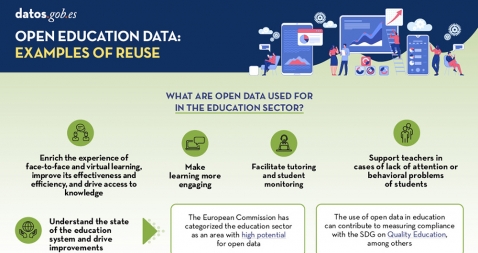 |
Published: May 2023 Open data is a key for the strengthening and progress of education and we must no forget thatbsp;education is a universal right and one of the main tools for the progress of humanity. In this infographic we summarize the benefits of utilizing open data in education |
LegalTech: Transformative potencial of legal services
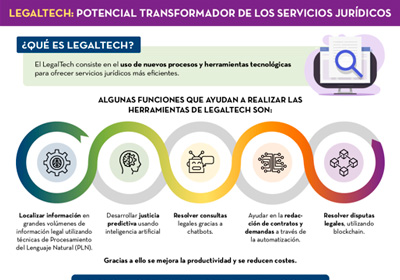 |
Published: August 2022 The LegalTech concept refers to the use of new technological processes and tools to offer more efficient legal services. For all these tools to work properly, it is necessary to have valuable data. In this sense, open data is a great opportunity. Find out more information in this inforgraphic. |
How is open data used in the health and welfare sector?
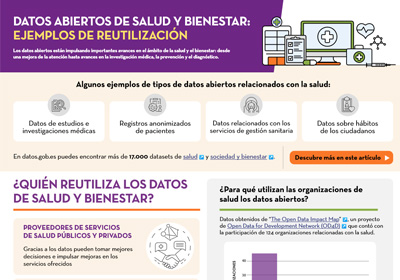 |
Published: September 2021 Open health data is essential for management and decision making by our governments, but it is also fundamental as a basis for solutions that help both patients and doctors. This infographic shows several examples, both of applications that collect health services and of tools for forecasting and diagnosing diseases, among others. |
Open data use cases to care for the environment and fight climate change
 |
Published: November 2020 This interactive infographic shows the strategic, regulatory and political situation affecting the world of open data in Spain and Europe. It includes the main points of the European Data Strategy, the Regulation on Data Governance in Europe or the Spain Digital 2025 plan, among others. |
Public administrations faced with the reuse of public information
 |
Published: August 2020 Public administrations play an important role in the open data ecosystem, both as information providers and consumers. This infographic contains a series of examples of success stories and best practices, compiled in the report "Las Administraciones Públicas ante la reutilización de la información pública" by the National Observatory of Telecommunications and the Information Society (ONTSI). |
The importance of opening cultural data
 |
Published: June 2020 Did you know that 90% of the world''s cultural heritage has not yet been digitized? Discover in this infographic the benefits of open cultural data, as well as examples of the products that can be created through its reuse, and success stories of museums that share open collections. |
Open data, especially valuable for small and medium-sized companies
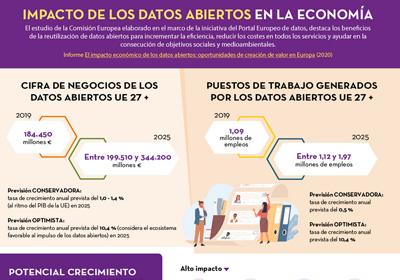 |
Published: March 2020 This infographic shows the results of the study "The Impact of open data: opportunities for value creation in Europe", conducted by the European Data Portal. Find out what the expected annual growth rate is, both in terms of turnover and jobs.(only available in Spanish). |
Noticia
In recent months, the Canary Islands data initiative strategy has focused on centralization, with the aim of providing citizens with access to public information through a single access point. With this motive launched a new version of their open data portal, data.canarias.es, and have continued to develop projects that display data in a simple and unified way. An example is the Government Organizational Chart that they have recently published.
Interesting data on the organizational structure and policy makers in a single portal
The Organizational chart of the Government of the Canary Islands is a web portal that openly offers information of interest related to both the organic structure and the political representatives in the Government of the Canary Islands. Its launch has been carried out by the General Directorate of Transparency and Citizen Participation, dependent on the Ministry of Public Administrations, Justice and Security of the Government of the Canary Islands.
From the beginning, the Organization Chart has been designed with the opening of data by default, accessibility and usability in mind. The tool consumes data published on the Canary Islands open data portal, such as the salaries of public officials and temporary personnel, through its API. It also includes numerous sections with information on autonomous bodies, public entities, public business entities, commercial companies, public foundations, consortia or collegiate bodies, automatically extracted from the corporate toolDirectory of Administrative Units and Registry and Citizen Services Offices (DIRCAC).
All the content of the Organization Chart is published, in turn, in an automated and periodic way, on the Canary Islands open data portal. The Organizational Chart data is published on the Canary Islands open data portal, as well as the remuneration, the organic structure or the registry and citizen service offices. They are updated automatically, once a month, taking the data from the information systems and publishing them on the open data portal. This configuration is fully parameterizable and can be adapted to the frequency that is considered necessary.
From the organization chart itself, all data can be downloaded both in open and editable format (ODT) and in a format that allows it to be viewed on any device (PDF).
What information is available in the Organization Chart?
Thanks to the Organizational Chart, citizens can find out who is part of the regional government. The information appears divided into eleven main areas: Presidency and the ten ministries.
In the Organizational Chart, the resumes, salaries and declarations of assets of all the high positions that make up the Government are available, in addition to the temporary personnel who work with them. Likewise, the emails, the address of their offices and the web pages of each area are also displayed. All this information is constantly updated, reflecting any changes that occur.
Regarding the agendas for the transparency of public activity, which are accessible from each of the files of public positions in the Organizational Chart, it should be noted that, thanks to the efforts, it has been achieved:
- Update the application so that agendas can be managed from any device (mobile, tablet, PC,…), thereby improving their use by the responsible persons.
- Categorize the events that, in addition, are visually highlighted by a color code, thus facilitating their location by the public.
- Publish immediately, and automatically, all the changes that are made in the agendas in the Organization Chart.
- Incorporate more information, such as the location of the events or the data of the attendees.
- Download the data of the calendars in open formats such as CSV or JSON, or in ICAL format, which will allow adding these events to other calendars.
- Publish all the information of the agendas in the Canary Islands open data portal, including an API for direct consumption.
At the moment, the agendas of the members of the Governing Council, the Vice-counselors and the Vice-counselors have been published, but it is planned that the agendas of the rest of the public positions of the Government of the Canary Islands will be incorporated progressively.
The Organization Chart was presented at the International Congress on Transparency, held last September in Alicante, as an example not only of openness and reuse of data, but also of transparency and accountability. All this has been developed by a team of people committed to transparency, accountability and open data, all principles of Open Government, in order to offer better services to citizens.
Documentación
1. Introduction
Data visualization is a task linked to data analysis that aims to graphically represent underlying data information. Visualizations play a fundamental role in the communication function that data possess, since they allow to drawn conclusions in a visual and understandable way, allowing also to detect patterns, trends, anomalous data or to project predictions, alongside with other functions. This makes its application transversal to any process in which data intervenes. The visualization possibilities are very numerous, from basic representations, such as a line graphs, graph bars or sectors, to complex visualizations configured from interactive dashboards.
Before we start to build an effective visualization, we must carry out a pre-treatment of the data, paying attention to how to obtain them and validating the content, ensuring that they do not contain errors and are in an adequate and consistent format for processing. Pre-processing of data is essential to start any data analysis task that results in effective visualizations.
A series of practical data visualization exercises based on open data available on the datos.gob.es portal or other similar catalogues will be presented periodically. They will address and describe, in a simple way; the stages necessary to obtain the data, perform the transformations and analysis that are relevant for the creation of interactive visualizations, from which we will be able summarize on in its final conclusions the maximum mount of information. In each of the exercises, simple code developments will be used (that will be adequately documented) as well as free and open use tools. All generated material will be available for reuse in the Data Lab repository on Github.
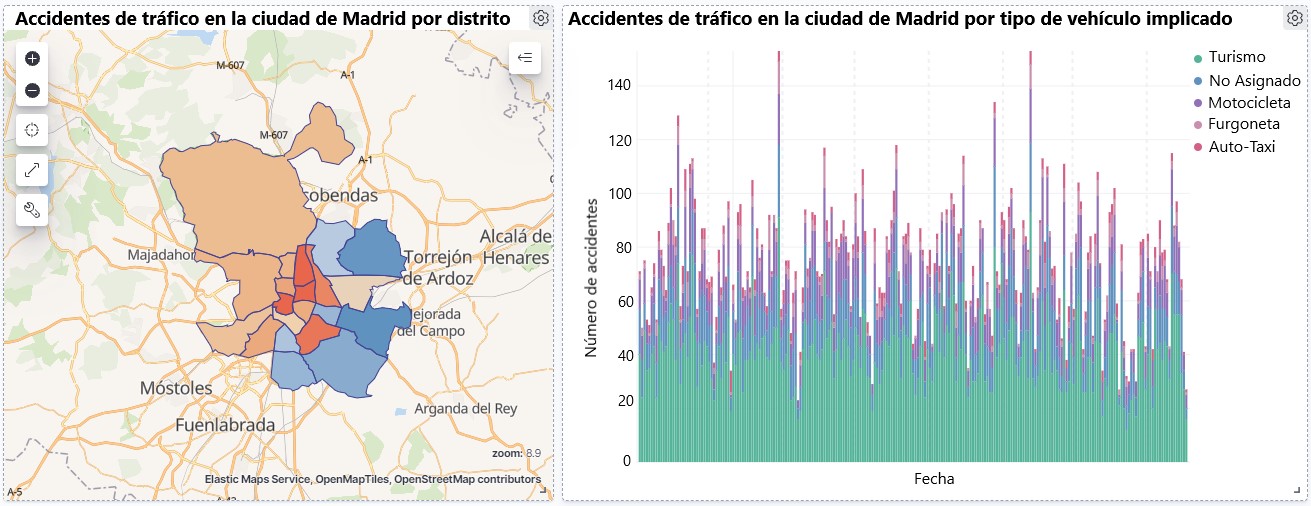
Visualization of traffic accidents occurring in the city of Madrid, by district and type of vehicle
2. Objetives
The main objective of this post is to learn how to make an interactive visualization based on open data available on this portal. For this exercise, we have chosen a dataset that covers a wide period and contains relevant information on the registration of traffic accidents that occur in the city of Madrid. From these data we will observe what is the most common type of accidents in Madrid and the incidence that some variables such as age, type of vehicle or the harm produced by the accident have on them.
3. Resources
3.1. Datasets
For this analysis, a dataset available in datos.gob.es on traffic accidents in the city of Madrid published by the City Council has been selected. This dataset contains a time series covering the period 2010 to 2021 with different subcategories that facilitate the analysis of the characteristics of traffic accidents that occurred. For example, the environmental conditions in which each accident occurred or the type of accident. Information on the structure of each data file is available in documents covering the period 2010-2018 and 2019 onwards. It should be noted that there are inconsistencies in the data before and after the year 2019, due to data structure variations. This is a common situation that data analysts must face when approaching the preprocessing tasks of the data that will be used, this is derived from the lack of a homogeneous structure of the data over time. For example, alterations on the number of variables, modification of the type of variables or changes to different measurement units. This is a compelling reason that justifies the need to accompany each open data set with complete documentation explaining its structure.
3.2. Tools
R (versión 4.0.3) and RStudio with the RMarkdown complement have been used to carry out the pre-treatment of the data (work environment setup, programming and writing).
R is an object-oriented and interpreted open-source programming language, initially created for statistical computing and the creation of graphical representations. Nowadays, it is a very powerful tool for all types of data processing and manipulation permanently updated. It contains a programming environment, RStudio, also open source.
The Kibana tool has been used for the creation of the interactive visualization.
Kibana is an open source tool that belongs to the Elastic Stack product suite (Elasticsearch, Beats, Logstash and Kibana) that enables visualization creation and exploration of indexed data on top of the Elasticsearch analytics engine.
If you want to know more about these tools or anyother that can help you in data processing and creating interactive visualizations, you can consult the report \"Data processing and visualization tools\".
4. Data processing
For the realization of the subsequent analysis and visualizations, it is necessary to prepare the data adequately, so that the results obtained are consistent and effective. We must perform an exploratory data analysis (EDA), in order to know and understand the data with which we want to work. The main objective of this data pre-processing is to detect possible anomalies or errors that could affect the quality of subsequent results and identify patterns of information contained in the data.
To facilitate the understanding of readers not specialized in programming, the R code included below, which you can access by clicking on the \"Code\" button in each section, is not designed to maximize its efficiency, but to facilitate its understanding, so it is possible that more advanced readers in this language might consider alternatives more efficient to encode some functionalities. The reader will be able to reproduce this analysis if desired, as the source code is available on datos.gob.es's Github account. In order to provide the code a plain text document will be used, which once loaded into the development environment can be easily executed or modified if desired.
4.1. Installation and loading of libraries
For the development of this analysis, we need to install a series of additional R packages to the base distribution, incorporating the functions and objects defined by them into the work environment. There are many packages available in R but the most suitable to work with this dataset are: tidyverse, lubridate and data.table.Tidyverse is a collection of R packages (it contains other packages such as dplyr, ggplot2, readr, etc.) specifically designed to work in Data Science, facilitating the loading and processing of data, and graphical representations and other essential functionalities for data analysis. It requires a progressive knowledge to get the most out of the packages that integrates. On the other hand, the lubridate package will be used for the management of date variables. Finally the data.table package allows a more efficient management of large data sets. These packages will need to be downloaded and installed in the development environment.
#Lista de librerías que queremos instalar y cargar en nuestro entorno de desarrollo librerias <- c(\"tidyverse\", \"lubridate\", \"data.table\")#Descargamos e instalamos las librerías en nuestros entorno de desarrollo package.check <- lapplay (librerias, FUN = function(x) { if (!require (x, character.only = TRUE)) { install.packages(x, dependencies = TRUE) library (x, character.only = TRUE } }4.2. Uploading and cleaning data
a. Loading datasets
The data that we are going to use in the visualization are divided by annuities in CSV files. As we want to perform an analysis of several years we must download and upload in our development environment all the datasets that interest us.
To do this, we generate the working directory \"datasets\", where we will download all the datasets. We use two lists, one with all the URLs where the datasets are located and another with the names that we assign to each file saved on our machine, with this we facilitate subsequent references to these files.
#Generamos una carpeta en nuestro directorio de trabajo para guardar los datasets descargadosif (dir.exists(\".datasets\") == FALSE)#Nos colocamos dentro de la carpetasetwd(\".datasets\")#Listado de los datasets que nos interese descargardatasets <- c(\"https://datos.madrid.es/egob/catalogo/300228-10-accidentes-trafico-detalle.csv\", \"https://datos.madrid.es/egob/catalogo/300228-11-accidentes-trafico-detalle.csv\", \"https://datos.madrid.es/egob/catalogo/300228-12-accidentes-trafico-detalle.csv\", \"https://datos.madrid.es/egob/catalogo/300228-13-accidentes-trafico-detalle.csv\", \"https://datos.madrid.es/egob/catalogo/300228-14-accidentes-trafico-detalle.csv\", \"https://datos.madrid.es/egob/catalogo/300228-15-accidentes-trafico-detalle.csv\", \"https://datos.madrid.es/egob/catalogo/300228-16-accidentes-trafico-detalle.csv\", \"https://datos.madrid.es/egob/catalogo/300228-17-accidentes-trafico-detalle.csv\", \"https://datos.madrid.es/egob/catalogo/300228-18-accidentes-trafico-detalle.csv\", \"https://datos.madrid.es/egob/catalogo/300228-19-accidentes-trafico-detalle.csv\", \"https://datos.madrid.es/egob/catalogo/300228-21-accidentes-trafico-detalle.csv\", \"https://datos.madrid.es/egob/catalogo/300228-22-accidentes-trafico-detalle.csv\")#Descargamos los datasets de interésdt <- list()for (i in 1: length (datasets)){ files <- c(\"Accidentalidad2010\", \"Accidentalidad2011\", \"Accidentalidad2012\", \"Accidentalidad2013\", \"Accidentalidad2014\", \"Accidentalidad2015\", \"Accidentalidad2016\", \"Accidentalidad2017\", \"Accidentalidad2018\", \"Accidentalidad2019\", \"Accidentalidad2020\", \"Accidentalidad2021\") download.file(datasets[i], files[i]) filelist <- list.files(\".\") print(i) dt[i] <- lapply (filelist[i], read_delim, sep = \";\", escape_double = FALSE, locale = locale(encoding = \"WINDOWS-1252\", trim_ws = \"TRUE\") }b. Creating the worktable
Once we have all the datasets loaded into our development environment, we create a single worktable that integrates all the years of the time series.
Accidentalidad <- rbindlist(dt, use.names = TRUE, fill = TRUE)Once the worktable is generated, we must solve one of the most common problems in all data preprocessing: the inconsistency in the naming of the variables in the different files that make up the time series. This anomaly produces variables with different names, but we know that they represent the same information. In this case it is explained in the data dictionary described in the documentation of the files, if this was not the case, it is necessary to resort to the observation and descriptive exploration of the files. In this case, the variable \"\"RANGO EDAD\"\" that presents data from 2010 to 2018 and the variable \"\"RANGO EDAD\"\" that presents the same data but from 2019 to 2021 are different. To solve this problem, we must unite/merge the variables that present this anomaly in a single variable.
#Con la función unite() unimos ambas variables. Debemos indicarle el nombre de la tabla, el nombre que queremos asignarle a la variable y la posición de las variables que queremos unificar. Accidentalidad <- unite(Accidentalidad, LESIVIDAD, c(25, 44), remove = TRUE, na.rm = TRUE)Accidentalidad <- unite(Accidentalidad, NUMERO_VICTIMAS, c(20, 27), remove = TRUE, na.rm = TRUE)Accidentalidad <- unite(Accidentalidad, RANGO_EDAD, c(26, 35, 42), remove = TRUE, na.rm = TRUE)Accidentalidad <- unite(Accidentalidad, TIPO_VEHICULO, c(20, 27), remove = TRUE, na.rm = TRUE)Once we have the table with the complete time series, we create a new table counting only the variables that are relevant to us to make the interactive visualization that we want to develop.
Accidentalidad <- Accidentalidad %>% select (c(\"FECHA\", \"DISTRITO\", \"LUGAR ACCIDENTE\", \"TIPO_VEHICULO\", \"TIPO_PERSONA\", \"TIPO ACCIDENTE\", \"SEXO\", \"LESIVIDAD\", \"RANGO_EDAD\", \"NUMERO_VICTIMAS\") c. Variable transformation
Next, we examine the type of variables and values to transform the necessary variables to be able to perform future aggregations, graphs or different statistical analyses.
#Re-ajustar la variable tipo fechaAccidentalidad$FECHA <- dmy (Accidentalidad$FECHA #Re-ajustar el resto de variables a tipo factor Accidentalidad$'TIPO ACCIDENTE' <- as.factor(Accidentalidad$'TIPO.ACCIDENTE')Accidentalidad$'Tipo Vehiculo' <- as.factor(Accidentalidad$'Tipo Vehiculo')Accidentalidad$'TIPO PERSONA' <- as.factor(Accidentalidad$'TIPO PERSONA')Accidentalidad$'Tramo Edad' <- as.factor(Accidentalidad$'Tramo Edad')Accidentalidad$SEXO <- as.factor(Accidentalidad$SEXO)Accidentalidad$LESIVIDAD <- as.factor(Accidentalidad$LESIVIDAD)Accidentalidad$DISTRITO <- as.factor (Accidentalidad$DISTRITO)d. Creation of new variables
Let's divide the variable \"\"FECHA\"\" into a hierarchy of variables of date types, \"\"Año\", \"\"Mes\"\" and \"\"Día\"\". This action is very common in data analytics, since it is interesting to analyze other time ranges, for example; years, months, weeks (and any other unit of time), or we need to generate aggregations from the day of the week.
#Generación de la variable AñoAccidentalidad$Año <- year(Accidentalidad$FECHA)Accidentalidad$Año <- as.factor(Accidentalidad$Año) #Generación de la variable MesAccidentalidad$Mes <- month(Accidentalidad$FECHA)Accidentalidad$Mes <- as.factor(Accidentalidad$Mes)levels (Accidentalidad$Mes) <- c(\"Enero\", \"Febrero\", \"Marzo\", \"Abril\", \"Mayo\", \"Junio\", \"Julio\", \"Agosto\", \"Septiembre\", \"Octubre\", \"Noviembre\", \"Diciembre\") #Generación de la variable DiaAccidentalidad$Dia <- month(Accidentalidad$FECHA)Accidentalidad$Dia <- as.factor(Accidentalidad$Dia)levels(Accidentalidad$Dia)<- c(\"Domingo\", \"Lunes\", \"Martes\", \"Miercoles\", \"Jueves\", \"Viernes\", \"Sabado\")e. Detection and processing of lost data
The detection and processing of lost data (NAs) is an essential task in order to be able to process the variables contained in the table, since the lack of data can cause problems when performing aggregations, graphs or statistical analysis.
Next, we will analyze the absence of data (detection of NAs) in the table:
#Suma de todos los NAs que presenta el datasetsum(is.na(Accidentalidad))#Porcentaje de NAs en cada una de las variablescolMeans(is.na(Accidentalidad))Once the NAs presented by the dataset have been detected, we must treat them somehow. In this case, as all the interesting variables are categorical, we will complete the missing values with the new value \"Unassigned\", this way we do not lose sample size and relevant information.
#Sustituimos los NAs de la tabla por el valor \"No asignado\"Accidentalidad [is.na(Accidentalidad)] <- \"No asignado\"f. Level assignments in variables
Once we have the variables of interest in the table, we can perform a more exhaustive analysis of the data and categories presented by each of the variables. If we analyze each one independently, we can see that some of them have repeated categories, simply by use of accents, special characters or capital letters. We will reassign the levels to the variables that require so that future visualizations or statistical analysis are built efficiently and without errors.
For space reasons, in this post we will only show an example with the variable \"HARMFULNESS\". This variable was typified until 2018 with a series of categories (IL, HL, HG, MT), while from 2019 other categories were used (values from 0 to 14). Fortunately, this task is easily approachable since it is documented in the information about the structure that accompanies each dataset. This issue (as we have said before), that does not always happen, greatly hinders this type of data transformations.
#Comprobamos las categorías que presenta la variable \"LESIVIDAD\"levels(Accidentalidad$LESIVIDAD)#Asignamos las nuevas categoríaslevels(Accidentalidad$LESIVIDAD)<- c(\"Sin asistencia sanitaria\", \"Herido leve\", \"Herido leve\", \"Herido grave\", \"Fallecido\", \"Herido leve\", \"Herido leve\", \"Herido leve\", \"Ileso\", \"Herido grave\", \"Herido leve\", \"Ileso\", \"Fallecido\", \"No asignado\")#Comprobamos de nuevo las catergorías que presenta la variablelevels(Accidentalidad$LESIVIDAD)4.3. Dataset Summary
Let's see what variables and structure the new dataset presents after the transformations made:
str(Accidentalidad)summary(Accidentalidad)The output of these commands will be omitted for reading simplicity. The main characteristics of the dataset are:
- It is composed of 14 variables: 1 date variable and 13 categorical variables.
- The time range covers from 01-01-2010 to 31-06-2021 (the end date may vary, since the dataset of the year 2021 is being updated periodically).
- For space reasons in this post, not all available variables have been considered for analysis and visualization.
4.4. Save the generated dataset
Once we have the dataset with the structure and variables ready for us to perform the visualization of the data, we will save it as a data file in CSV format to later perform other statistical analysis. Or use it in other data processing or visualization tools such as the one we address below. It is important to save it with a UTF-8 (Unicode Transformation Format) encoding so that special characters are correctly identified by any software.
write.csv(Accidentalidad, file = Accidentalidad.csv\", fileEncoding=\"UTF-8\")5. Creation of the visualization on traffic accidents that occur in the city of Madrid using Kibana
To create this interactive visualization the Kibana tool (in its free version) has been used on our local environment. Before being able to perform the visualization it is necessary to have the software installed since we have followed the steps of the download and installation tutorial provided by the company Elastic.
Once the Kibana software is installed, we proceed to develop the interactive visualization. Below there are two video tutorials, which show the process of creating the visualization and interacting with it.
This first video tutorial shows the visualization development process by performing the following steps:
- Loading data into Elasticsearch, generating an index in Kibana that allows us to interact with the data practically in real time and interaction with the variables presented by the dataset.
- Generation of the following graphical representations:
- Line graph to represent the time series on traffic accidents that occurred in the city of Madrid.
- Horizontal bar chart showing the most common accident type
- Thematic map, we will show the number of accidents that occur in each of the districts of the city of Madrid. For the creation of this visual it is necessary to download the \"dataset containing the georeferenced districts in GeoJSON format\".
- Construction of the dashboard integrating the visuals generated in the previous step.
In this second video tutorial we will show the interaction with the visualization that we have just created:
6. Conclusions
Observing the visualization of the data on traffic accidents that occurred in the city of Madrid from 2010 to June 2021, the following conclusions can be drawn:
- The number of accidents that occur in the city of Madrid is stable over the years, except for 2019 where a strong increase is observed and during the second quarter of 2020 where a significant decrease is observed, which coincides with the period of the first state of alarm due to the COVID-19 pandemic.
- Every year there is a decrease in the number of accidents during the month of August.
- Men tend to have a significantly higher number of accidents than women.
- The most common type of accident is the double collision, followed by the collision of an animal and the multiple collision.
- About 50% of accidents do not cause harm to the people involved.
- The districts with the highest concentration of accidents are: the district of Salamanca, the district of Chamartín and the Centro district.
Data visualization is one of the most powerful mechanisms for autonomously exploiting and analyzing the implicit meaning of data, regardless of the degree of the user's technological knowledge. Visualizations allow us to build meaning on top of data and create narratives based on graphical representation.
If you want to learn how to make a prediction about the future accident rate of traffic accidents using Artificial Intelligence techniques from this data, consult the post on \"Emerging technologies and open data: Predictive Analytics\".
We hope you liked this post and we will return to show you new data reuses. See you soon!
Blog
Life happens in real time and much of our life, today, takes place in the digital world. Data, our data, is the representation of how we live hybrid experiences between the physical and the virtual. If we want to know what is happening around us, we must analyze the data in real time. In this post, we explain how.
Introduction
Let's imagine the following situation: we enter our favorite online store, we search for a product we want and we get a message on the screen saying that the price of the product shown is from a week ago and we have no information about the current price of the product. Someone in charge of the data processes of that online store could say that this is the expected behavior since the price database uploads from the central system to the e-commerce are weekly. Fortunately, this online experience is unthinkable today in an e-commerce, but far from what you might think, it is a common situation in many other processes of companies and organizations. It has happened to all of us that being registered in a database of a business, when we go to a store different from our usual one, opps, it turns out that we are not listed as customers. Again, this is because the data processing (in this case the customer database) is centralized and the loads to peripheral systems (after-sales service, distributors, commercial channel) are done in batch mode. This, in practice, means that data updates can take days or even weeks.
In the example above, batch mode thinking about data can unknowingly ruin the experience of a customer or user. Batch thinking can have serious consequences such as: the loss of a customer, the worsening of the brand image or the loss of the best employees.
Benefits of using real-time data
There are situations in which data is simply either real-time or it is not. A very recognizable example is the case of transactions, banking or otherwise. We cannot imagine that payment in a store does not occur in real time (although sometimes the payment terminals are out of coverage and this causes annoying situations in physical stores). Nor can (or should) it happens that when passing through a toll booth on a highway, the barrier does not open in time (although we have probably all experienced some bizarre situation in this context).
However, in many processes and situations it can be a matter of debate and discussion whether to implement a real-time data strategy or simply follow conventional approaches, trying to have a time lag in (data) analysis and response times as low as possible. Below, we list some of the most important benefits of implementing real-time data strategies:
- Immediate reaction to an error. Errors happen and with data it is no different. If we have a real-time monitoring and alerting system, we will react before it is too late to an error.
- Drastic improvement in the quality of service. As we have mentioned, not having the right information at the time it is needed can ruin the experience of our service and with it the loss of customers or potential customers. If our service fails, we must know about it immediately to be able to fix it and solve it. This is what makes the difference between organizations that have adapted to digital transformation and those that have not.
- Increasing sales. Not having the data in real time, can make you lose a lot of money and profitability. Let's imagine the following example, which we will see in more detail in the practical section. If we have a business in which the service we provide depends on a limited capacity (a chain of restaurants, hotels or a parking lot, for example) it is in our interest to have our occupancy data in real time, since this means that we can sell our available service capacity more dynamically.
The technological part of real time
For years, data analysis was originally conceived in batch mode. Historical data loads, every so often, in processes that are executed only under certain conditions. The reason is that there is a certain technological complexity behind the possibility of capturing and consuming data at the very moment it is generated. Traditional data warehouses, (relational) databases, for example, have certain limitations for working with fast transactions and for executing operations on data in real time. There is a huge amount of documentation on this subject and on how technological solutions have been incorporating technology to overcome these barriers. It is not the purpose of this post to go into the technical details of the technologies to achieve the goal of capturing and analyzing data in real time. However, we will comment that there are two clear paradigms for building real-time solutions that need not be mutually exclusive.
- Solutions based on classic mechanisms and flows of data capture, storage (persistence) and exposure to specific consumption channels (such as a web page or an API).
- Solutions based on event-driven availability mechanisms, in which data is generated and published regardless of who and how it will be consumed.
A practical example
As we usually do in this type of posts, we try to illustrate the topic of the post with a practical example with which the reader can interact. In this case, we are going to use an open dataset from the datos.gob.es catalog. In particular, we are going to use a dataset containing information on the occupancy of public parking spaces in the city center of Malaga. The dataset is available at this link and can be explored in depth through this link. The data is accessible through this API. In the description of the dataset it is indicated that the update frequency is every 2 minutes. As mentioned above, this is a good example in which having the data available in real time[1] has important advantages for both the service provider and the users of the service. Not many years ago it was difficult to think of having this information in real time and we were satisfied with aggregated information at the end of the week or month on the evolution of the occupancy of parking spaces.
From the data set we have built an interactive app where the user can observe in real time the occupancy level through graphic displays. The reader has at his disposal the code of the example to reproduce it at any time.
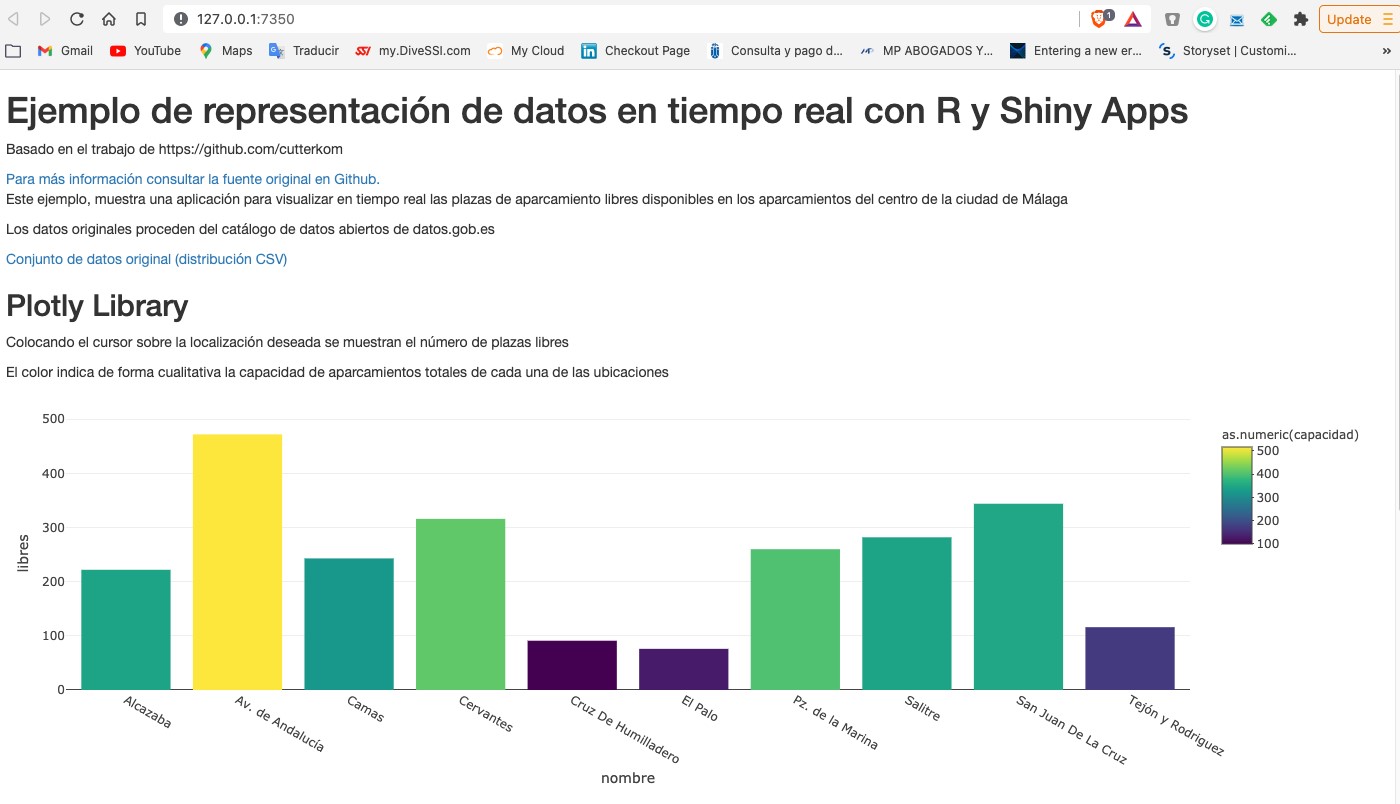
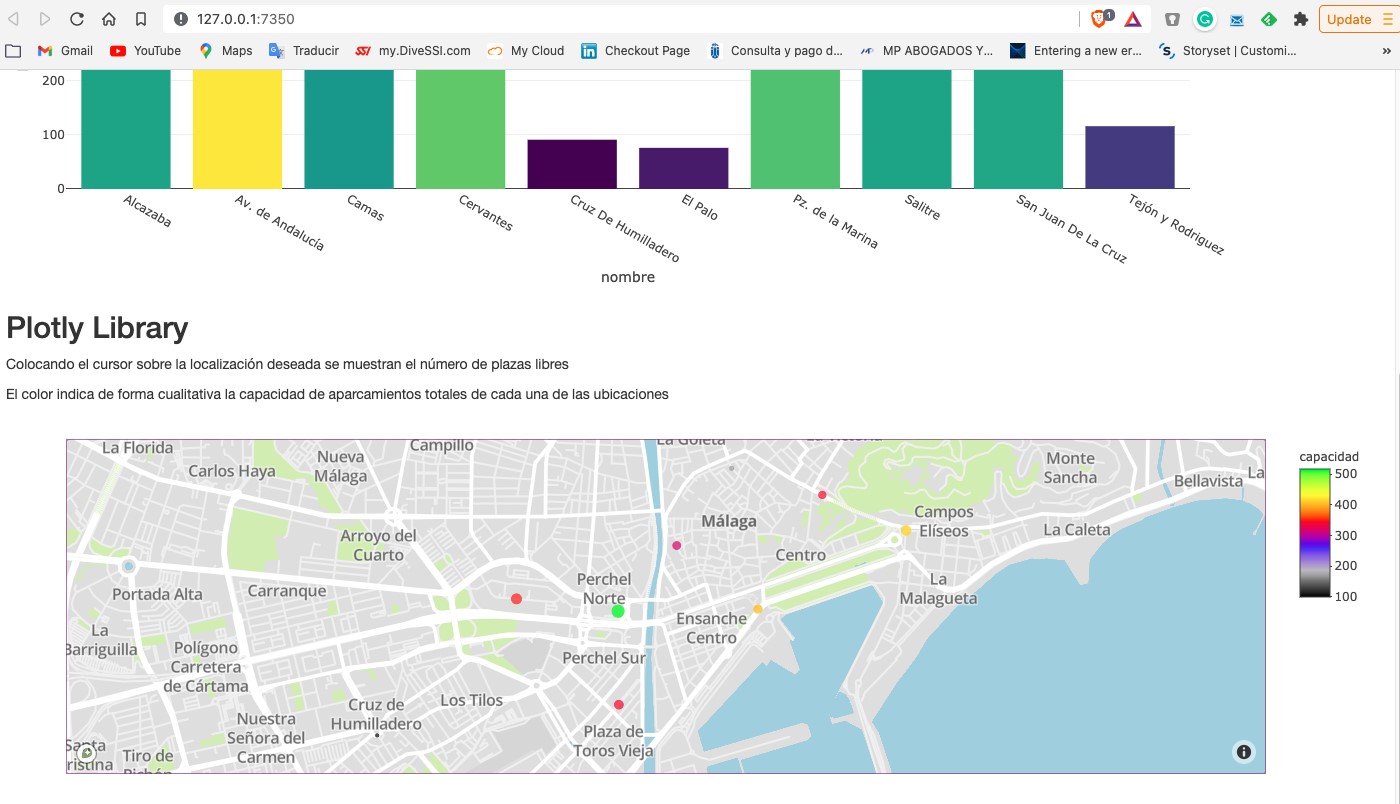
In this example, we have seen how, from the moment the occupancy sensors communicate their status (free or occupied) until we consume the data in a web application, this same data has gone through several systems and even had to be converted to a text file to expose it to the public. A much more efficient system would be to publish the data in an event broker that can be subscribed to with real-time technologies. In any case, through this API we are able to capture this data in real time and represent it in a web application ready for consumption and all this with less than 150 lines of code. Would you like to try it?
In conclusion, the importance of real-time data is now fundamental to most processes, not just space management or online commerce. As the volume of real-time data increases, we need to shift our thinking from a batch perspective to a real-time first mindset. That is, let's think directly that data must be available for real-time consumption from the moment it is generated, trying to minimize the number of operations we do with it before we can consume it.
[1] The term real time can be ambiguous in certain cases. In the context of this post, we can consider real time to be the characteristic data update time that is relevant to the particular domain we are working in. For example, in this use case an update rate of 2 min is sufficient and can be considered real time. If we were analysing a use case of stock quotes the concept of real time would be in the order of seconds.
Content prepared by Alejandro Alija, expert in Digital Transformation and Innovation.
The contents and views expressed in this publication are the sole responsibility of the author.