Blog
The demand for professionals with skills related to data analytics continues to grow and it is already estimated that just the industry in Spain would need more than 90,000 data and artificial intelligence professionals to boost the economy. Training professionals who can fill this gap is a major challenge. Even large technology companies such as Google, Amazon or Microsoft are proposing specialised training programmes in parallel to those proposed by the formal education system. And in this context, open data plays a very relevant role in the practical training of these professionals, as open data is often the only possibility to carry out real exercises and not just simulated ones.
Moreover, although there is not yet a solid body of research on the subject, some studies already suggest positive effects derived from the use of open data as a tool in the teaching-learning process of any subject, not only those related to data analytics. Some European countries have already recognised this potential and have developed pilot projects to determine how best to introduce open data into the school curriculum.
In this sense, open data can be used as a tool for education and training in several ways. For example, open data can be used to develop new teaching and learning materials, to create real-world data-based projects for students or to support research on effective pedagogical approaches. In addition, open data can be used to create opportunities for collaboration between educators, students and researchers to share best practices and collaborate on solutions to common challenges.
Projects based on real-world data
A key contribution of open data is its authenticity, as it is a representation of the enormous complexity and even flaws of the real world as opposed to artificial constructs or textbook examples that are based on much simpler assumptions.
An interesting example in this regard is documented by Simon Fraser University in Canada in their Masters in Publishing where most of their students come from non-STEM university programmes and therefore had limited data handling skills. The project is available as an open educational resource on the OER Commons platform and aims to help students understand that metrics and measurement are important strategic tools for understanding the world around us.
By working with real-world data, students can develop story-building and research skills, and can apply analytical and collaborative skills in using data to solve real-world problems. The case study conducted with the first edition of this open data-based OER is documented in the book "Open Data as Open Educational Resources - Case studies of emerging practice". It shows that the opportunity to work with data pertaining to their field of study was essential to keep students engaged in the project. However, it was dealing with the messiness of 'real world' data that allowed them to gain valuable learning and new practical skills.
Development of new learning materials
Open datasets have a great potential to be used in the development of open educational resources (OER), which are free digital teaching, learning and research materials, as they are published under an open licence (Creative Commons) that allows their use, adaptation and redistribution for non-commercial uses according to UNESCO's definition.
In this context, although open data are not always OER, we can say that they become OER when are used in pedagogical contexts. Open data used as an educational resource facilitates students to learn and experiment by working with the same datasets used by researchers, governments and civil society. It is a key component for students to develop analytical, statistical, scientific and critical thinking skills.
It is difficult to estimate the current presence of open data as part of OER but it is not difficult to find interesting examples within the main open educational resource platforms. On the Procomún platform we can find interesting examples such as Learning Geography through the evolution of agrarian landscapes in Spain, which builds a Webmap for learning about agrarian landscapes in Spain on the ArcGIS Online platform of the Complutense University of Madrid. The educational resource uses specific examples from different autonomous communities using photographs or geolocated still images and its own data integrated with open data. In this way, students work on the concepts not through a mere text description but with interactive resources that also favour the improvement of their digital and spatial competences.
On the OER Commons platform, for example, we find the resource "From open data to civic engagement", which is aimed at audiences from secondary school upwards, with the objective of teaching them to interpret how public money is spent in a given regional, local area or neighbourhood. It is based on the well-known projects to analyse public budgets "Where do my taxes go?", available in many parts of the world as a result of the transparency policies of public authorities. This resource could be easily ported to Spain, as there are numerous "Where do my taxes go?" projects, such as the one maintained by Fundación Civio.
Data-related skills
When we refer to training and education in data-related skills, we are actually referring to a very broad area that is also very difficult to master in all its facets. In fact, it is common for data-related projects to be tackled in teams where each member has a specialised role in one of these areas. For example, it is common to distinguish at least data cleaning and preparation, data modelling and data visualisation as the main activities performed in a data science and artificial intelligence project.
In all cases, the use of open data is widely adopted as a central resource in the projects proposed for the acquisition of any of these skills. The well-known data science community Kaggle organises competitions based on open datasets contributed to the community and which are an essential resource for real project-based learning for those who want to acquire data-related skills. There are other subscription-based proposals such as Dataquest or ProjectPro but in all cases they use real datasets from multiple general open data repositories or knowledge area specific repositories.
Open data, as in other areas, has not yet developed its full potential as a tool for education and training. However, as can be seen in the programme of the latest edition of the OER Conference 2022, there are an increasing number of examples of open data playing a central role in teaching, new educational practices and the creation of new educational resources for all kinds of subjects, concepts and skills
Content written by Jose Luis Marín, Senior Consultant in Data, Strategy, Innovation & Digitalization.
The contents and views reflected in this publication are the sole responsibility of the author.
Blog
Perhaps one of the most everyday uses of artificial intelligence that we can experience in our day-to-day lives is through interaction with artificial vision and object identification systems. From unlocking our smartphone to searching for images on the Internet. All these functionalities are possible thanks to artificial intelligence models in the field of image detection and classification. In this post we compile some of the most important open image repositories, thanks to which we have been able to train current image recognition models.
Introduction
Let's go back for a moment to late 2017, early 2018. The possibility of unlocking our smartphones with some kind of fingerprint reader has become widespread. With more or less success, most manufacturers had managed to include the biometric reader in their terminals. The unlocking time, the ease of use and the extra security provided were exceptional compared to the classic systems of passwords, patterns, etc. As has been the case since 2008, the undisputed leader in digital innovation in mobile terminals - Apple - revolutionised the market once again by incorporating an innovative unlocking system in the iPhone X using an image of our face. The so-called FaceID system scans our face to unlock the terminal in tenths of a second without having to use our hands. The probability of identity theft with this system was 1 in 1,000,000; 20 times more secure than its predecessor TouchID
Let this little story about an everyday functionality be used to introduce an important topic in the field of artificial intelligence, and in particular in the field of computer image processing: AI model training image repositories. We have talked a lot in this space about this field of artificial intelligence. A few months after the launch of FaceID, we published a post on AI, in which we mentioned near-human-level image classification as one of the most important achievements of AI in recent years. This would not be possible without the availability of open banks of annotated images[1] to train image recognition and classification models. In this post we list some of the most important (freely available) image repositories for model training.
Of course, recognising the number plate of a vehicle at the entrance to a car park is not the same as identifying a lung disease in an X-ray image. The banks of annotated images are as varied as the potential AI applications they enable.
Probably the 2 best known image repositories are MNIST and ImageNET.
- MNIST, is a set of 70,000 black and white images of handwritten numbers normalised in size, ready to train number recognition algorithms. Professor LeCun's original paper is from 1998.
- ImageNET is a huge database of concepts (words or sets of words). Each concept with its own meaning is called a synset. Each synset is represented by hundreds or thousands of images. ImageNET's own website cites the project as an indispensable tool for the recent advancement of Deep Learning and computer vision.
The project has been instrumental in advancing computer vision and deep learning research. The data is available for free to researchers for non-commercial use
The most widely used subset of ImageNet is ImageNet Large Scale Visual Recognition Challenge ILSVRC, an image classification and localisation dataset. This image subset was used from 2010 to 2017 for the worldwide object detection and image classification competitions. This dataset covers 1000 object classes and contains more than one million training images, 50,000 validation images and 100,000 test images. This subset is available in Kaggle.
In addition to these two classic repositories that are already part of the history of image processing by artificial intelligence, we have some more current and varied thematic repositories. Here are some examples:
- The very annoying CAPTCHAs and reCAPTCHAs that we find on a multitude of websites to verify that we are human trying to access are a good example of artificial intelligence applied to the field of security. Of course, CAPTCHAs also need their own repository to check how effective they are in preventing unwanted access. We recommend reading this interesting article about the history of these web browsing companions.
- As we have seen several times in the past, one of the most promising applications of AI in the field of imaging is to assist physicians in diagnosing diseases from a medical imaging test (X-ray, CT scan, etc.). To make this a reality, there is no shortage of efforts to collect, annotate and make available to the research community repositories of quality, anonymised medical images to train models for detecting objects, shapes and patterns that may reveal a possible disease. Breast cancer are 30% of all cancers in women worldwide. Hence the importance of having image banks that facilitate the training of specific models.
- The diagnosis of blood-based diseases often involves the identification and characterisation of patient blood samples. Automated methods (using medical imaging) to detect and classify blood cell subtypes have important medical applications.
- Three years ago, Covid19 burst into our lives, turning developed societies upside down with this global pandemic with terrible consequences in terms of human and economic loss. The entire scientific community threw itself into finding a solution in record time to tackle the consequences of the new coronavirus. Many efforts were made to improve the diagnosis of the disease. Some techniques relied on AI-assisted image analysis. At the same time, health authorities incorporated a new element in our daily routine - face masks. Even today, in some situations the mask is still mandatory, and during these 3 years we have had to monitor its proper use in almost all kinds of places. So much so that in recent months there has been a proliferation of specific image banks to train AI and computer vision models to detect the use of masks autonomously.
- For more information on open repositories related to health and wellbeing, we leave you with this post we published a few months ago.
In addition to these curious examples cited in this post, we encourage you to explore Kaggle's section of datasets that include images as data. You only have 10,000 sets to browse through ;)
[1] Annotated image repositories contain, in addition to the image files (jpeg, tiff, etc.), descriptive files with metadata identifying each image. Typically, these files (csv, JSON or XML) include a unique identifier for each image as well as fields that provide information about the content of the image. For example, the name of the object that appears in the image.
Content prepared by Alejandro Alija, expert in Digital Transformation and Innovation.
The contents and views expressed in this publication are the sole responsibility of the author.
Blog
After several months of tests and different types of training, the first massive Artificial Intelligence system in the Spanish language is capable of generating its own texts and summarising existing ones. MarIA is a project that has been promoted by the Secretary of State for Digitalisation and Artificial Intelligence and developed by the National Supercomputing Centre, based on the web archives of the National Library of Spain (BNE).
This is a very important step forward in this field, as it is the first artificial intelligence system expert in understanding and writing in Spanish. As part of the Language Technology Plan, this tool aims to contribute to the development of a digital economy in Spanish, thanks to the potential that developers can find in it.
The challenge of creating the language assistants of the future
MarIA-style language models are the cornerstone of the development of the natural language processing, machine translation and conversational systems that are so necessary to understand and automatically replicate language. MarIA is an artificial intelligence system made up of deep neural networks that have been trained to acquire an understanding of the language, its lexicon and its mechanisms for expressing meaning and writing at an expert level.
Thanks to this groundwork, developers can create language-related tools capable of classifying documents, making corrections or developing translation tools.
The first version of MarIA was developed with RoBERTa, a technology that creates language models of the "encoder" type, capable of generating an interpretation that can be used to categorise documents, find semantic similarities in different texts or detect the sentiments expressed in them.
Thus, the latest version of MarIA has been developed with GPT-2, a more advanced technology that creates generative decoder models and adds features to the system. Thanks to these decoder models, the latest version of MarIA is able to generate new text from a previous example, which is very useful for summarising, simplifying large amounts of information, generating questions and answers and even holding a dialogue.
Advances such as the above make MarIA a tool that, with training adapted to specific tasks, can be of great use to developers, companies and public administrations. Along these lines, similar models that have been developed in English are used to generate text suggestions in writing applications, summarise contracts or search for specific information in large text databases in order to subsequently relate it to other relevant information.
In other words, in addition to writing texts from headlines or words, MarIA can understand not only abstract concepts, but also their context.
More than 135 billion words at the service of artificial intelligence
To be precise, MarIA has been trained with 135,733,450,668 words from millions of web pages collected by the National Library, which occupy a total of 570 Gigabytes of information. The MareNostrum supercomputer at the National Supercomputing Centre in Barcelona was used for the training, and a computing power of 9.7 trillion operations (969 exaflops) was required.
Bearing in mind that one of the first steps in designing a language model is to build a corpus of words and phrases that serves as a database to train the system itself, in the case of MarIA, it was necessary to carry out a screening to eliminate all the fragments of text that were not "well-formed language" (numerical elements, graphics, sentences that do not end, erroneous encodings, etc.) and thus train the AI correctly.
Due to the volume of information it handles, MarIA is already the third largest artificial intelligence system for understanding and writing with the largest number of massive open-access models. Only the language models developed for English and Mandarin are ahead of it. This has been possible mainly for two reasons. On the one hand, due to the high level of digitisation of the National Library's heritage and, on the other hand, thanks to the existence of a National Supercomputing Centre with supercomputers such as the MareNostrum 4.
The role of BNE datasets
Since it launched its own open data portal (datos.bne.es) in 2014, the BNE has been committed to bringing the data available to it and in its custody closer: data on the works it preserves, but also on authors, controlled vocabularies of subjects and geographical terms, among others.
In recent years, the educational platform BNEscolar has also been developed, which seeks to offer digital content from the Hispánica Digital Library's documentary collection that may be of interest to the educational community.
Likewise, and in order to comply with international standards of description and interoperability, the BNE data are identified by means of URIs and linked conceptual models, through semantic technologies and offered in open and reusable formats. In addition, they have a high level of standardisation.
Next steps
Thus, and with the aim of perfecting and expanding the possibilities of use of MarIA, it is intended that the current version will give way to others specialised in more specific areas of knowledge. Given that it is an artificial intelligence system dedicated to understanding and generating text, it is essential for it to be able to cope with lexicons and specialised sets of information.
To this end, the PlanTL will continue to expand MarIA to adapt to new technological developments in natural language processing (more complex models than the GPT-2 now implemented, trained with larger amounts of data) and will seek ways to create workspaces to facilitate the use of MarIA by companies and research groups.
Content prepared by the datos.gob.es team.
Evento
Data has become one of the pillars of society's digital transformation process, which also challenges sectors such as justice and law enforcement. Thanks to them, access to information and statistics has been improved, allowing decision-making to be based on objective figures to which new techniques such as automation and artificial intelligence can be applied.
Thus, and with the aim of continuing to delve into the advantages derived from the data ecosystem, on 17 and 18 October, the University of Salamanca is organising, in collaboration with the Ministry of Justice, a symposium on Justice and Data.
What will be the themes to be addressed?
During the two days of the event and through the various presentations, the aim will be to discuss "the role of data for the proper functioning of public services". In other words, how open data can help to improve the efficiency and effectiveness with regard to citizens and the services offered to them.
In line with this idea, the questions that will form part of the symposium will revolve around the following themes:
- Personalised assistants
- Data Analytics
- Designing Data Visualisations
- Governance, Transparency and Open Data
- AI - NLP
- AI - Other
- Robotisation
- Data Sharing Spaces
- Data, AI, RPA Training
Thus, while the first day will be made up of conferences by relevant people from the Justice, Law and academic sectors, the second day will showcase the different initiatives of the international technology sector and the legal-tech sector related to data.
Likewise, in simultaneous rooms, public and private projects in which technology is applied to the services of Justice and Law will be analysed.
In conclusion, it is an event that seeks to become a meeting point for innovation in the field of justice. So that, through the exchange of experiences and success stories, between the administration, institutions and private companies in any field, it will be possible to guide the use of data to provide and give solutions to specific problems.
How can I attend?
Attendance at the conference will be free of charge and will take place at the Hospederia Arzobispo Fonseca in Salamanca. In order to attend, it will be necessary to fill in the following registration form. As with other similar events, this one will also be broadcast live online.
Blog
According to the latest analysis conducted by Gartner in September 2021, on Artificial Intelligence trends, Chatbots are one of the technologies that are closest to deliver effective productivity in less than 2 years. Figure 1, extracted from this report, shows that there are 4 technologies that are well past the peak of inflated expectations and are already starting to move out of the valley of disillusionment, towards states of greater maturity and stability, including chatbots, semantic search, machine vision and autonomous vehicles.
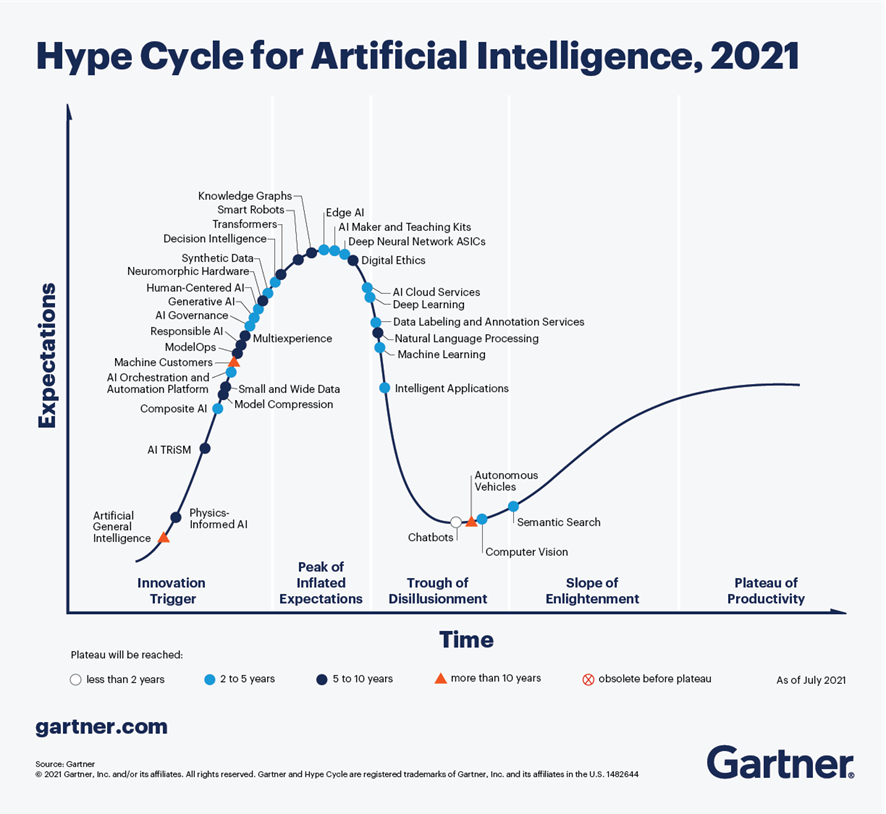
Figure 1-Trends in AI for the coming years.
In the specific case of chatbots, there are great expectations for productivity in the coming years thanks to the maturity of the different platforms available, both in Cloud Computing options and in open source projects, especially RASA or Xatkit. Currently it is relatively easy to develop a chatbot or virtual assistant without AI knowledge, using these platforms.
How does a chatbot work?
As an example, Figure 2 shows a diagram of the different components that a chatbot usually includes, in this case focused on the architecture of the RASA project.
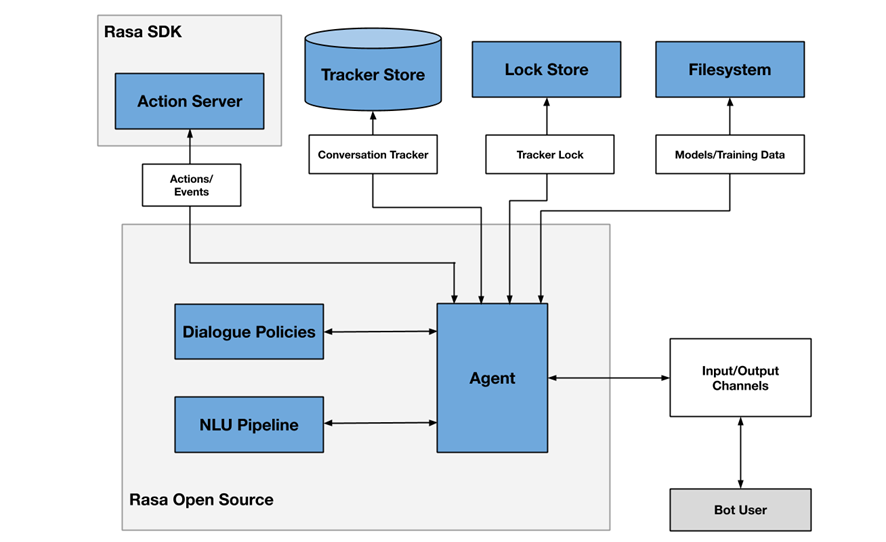
Figure 2- RASA project architecture
One of the main components is the agent module, which acts as a controller of the data flow and is normally the system interface with the different input/output channels offered to users, such as chat applications, social networks, web or mobile applications, etc.
The NLU (Natural Languge Understanding) module is responsible for identifying the user's intention (what he/she wants to consult or do), entity extraction (what he/she is talking about) and response generation. It is considered a pipeline because several processes of different complexity are involved, in many cases even through the use of pre-trained Artificial Intelligence models.
Finally, the dialogue policies module defines the next step in a conversation, based on context and message history. This module is integrated with other subsystems such as the conversation store (tracker store) or the server that processes the actions necessary to respond to the user (action server).
Chatbots in open data portals as a mechanism to locate data and access information
There are more and more initiatives to empower citizens to consult open data through the use of chatbots, using natural language interfaces, thus increasing the net value offered by such data. The use of chatbots makes it possible to automate data collection based on interaction with the user and to respond in a simple, natural and fluid way, allowing the democratization of the value of open data.
At SOM Research Lab (Universitat Oberta de Catalunya) they were pioneers in the application of chatbots to improve citizens' access to open data through the Open Data for All and BODI (Bots to interact with open data - Conversational interfaces to facilitate access to public data) projects. You can find more information about the latter project in this article.
It is also worth mentioning the Aragón Open Data chatbot, from the open data portal of the Government of Aragón, which aims to bring the large amount of data available to citizens, so that they can take advantage of its information and value, avoiding any technical or knowledge barrier between the query made and the existing open data. The domains on which it offers information are:
- General information about Aragon and its territory
- Tourism and travel in Aragon
- Transportation and agriculture
- Technical assistance or frequently asked questions about the information society.
Conclusions
These are just a few examples of the practical use of chatbots in the valorization of open data and their potential in the short term. In the coming years we will see more and more examples of virtual assistants in different scenarios, both in the field of public administrations and in private services, especially focused on improving user service in e-commerce applications and services arising from digital transformation initiatives.
Content prepared by José Barranquero, expert in Data Science and Quantum Computing.
The contents and points of view reflected in this publication are the sole responsibility of the author.
Evento
The pandemic situation we have experienced in recent years has led to a large number of events being held online. This was the case of the Iberian Conference on Spatial Data Infrastructures (JIIDE), whose 2020 and 2021 editions had a virtual format. However, the situation has changed and in 2022 we will be able to meet again to discuss the latest trends in geographic information.
Seville will host JIIDE 2022
Seville has been the city chosen to bring together all those professionals from the public administration, private sector and academia interested in geographic information and who use Spatial Data Infrastructures (SDI) in the exercise of their activities.
Specifically, the event will take place from 25 to 27 October at the University of Seville. You can find more information here.
Focus on user experience
This year's slogan is "Experience and technological evolution: bringing the SDI closer to citizens". The aim is to emphasise new technological trends and their use to provide citizens with solutions that solve specific problems, through the publication and processing of geographic information in a standardised, interoperable and open way.
Over three days, attendees will be able to share experiences and use cases on how to use Big Data, Artificial Intelligence and Cloud Computing techniques to improve the analysis capacity, storage and web publication of large volumes of data from various sources, including real-time sensors.
New specifications and standards that have emerged will also be discussed, as well as the ongoing evaluation of the INSPIRE Directive.
Agenda now available
Although some participations are still to be confirmed, the programme is already available on the conference website. There will be around 80 communications where experiences related to real projects will be presented, 7 technical workshops where specific knowledge will be shared and a round table to promote debate.
Among the presentations there are some focused on open data. This is the case of Valencia City Council, which will talk about how they use open data to obtain environmental equity in the city's neighbourhoods, or the session dedicated to the "Digital aerial photo library of Andalusia: a project for the convergence of SDIs and Open-Data".
How can I attend?
The event is free of charge, but to attend you need to register using this form. You must indicate the day you wish to attend.
For the moment, registration is open to attend in person, but in September, the website of the conference will offer the possibility of participating in the JIIDE virtually.
Organisers
The Jornadas Ibéricas de Infraestructuras de Datos Espaciales (JIIDE) were born from the collaboration of the Directorate General of Territory of Portugal, the National Geographic Institute of Spain and the Government of Andorra. On this occasion, the Institute of Statistics and Cartography of Andalusia and the University of Seville join as organisers.
Noticia
Artificial intelligence (AI) has been pervasive in our lives for several years now. While there is no exact definition of AI, one description could be "the ability of a machine to display human-like capabilities such as reasoning, learning, planning and creativity". This process is done through the creation and application of algorithms. In other words, AI refers to the ability of computers, software and other machines to think and act as humans would.
Artificial intelligence allows the development of different use cases that facilitate decision-making or provide solutions to complex problems. As a result, artificial intelligence has been able to revolutionise not only the business world but also the social sphere, with applications ranging from the rapid detection of cancer to the fight against deforestation in the Amazon, to name but a few examples.
Given all these advantages, it is not surprising that in recent years the demand for professional profiles related to this field has grown. Therefore, here are some examples of interesting courses and training that could help you to broaden your knowledge of artificial intelligence.
Online courses
Elements of AI
- Taught by: University of Helsinki and Reaktor
- Duration: 50 hours
- Language: English
- Price: Free
This massive open educational project (MOOC), which has already enrolled more than 750,000 students, offers you the opportunity to learn what artificial intelligence is, as well as showing how it can affect your work and personal life and how it will evolve in the coming years.
This course, which offers all citizens the possibility of training and first-hand knowledge of how AI works and the opportunities it offers, has been promoted in our country by the Secretary of State for Digitalisation and Artificial Intelligence together with the UNED.
Building AI
- Taught by: University of Helsinki and Reaktor
- Duration: 50 hours
- Language: English
- Price: Free
The authors of the previous course launched this new course some time later with the aim of closing the gap between courses for beginners such as 'Elements of AI' and the vast majority of training courses in this field, which usually present a more advanced level.
This course, which starts where the previous one ends, will help you to delve deeper into elements such as machine learning, neural networks or some practical applications of AI. It also offers you the option of setting up your first artificial intelligence project and getting started in programming if you wish.
Specialised programme: Introduction to artificial intelligence
- Taught by: Coursera (UNAM)
- Duration: 8 meses
- Language: Spanish
- Price: Free
This course is aimed at people who are interested in learning more about the different developments that have been generated over the last few years in the field of artificial intelligence.
If you opt for this training you will learn how to implement AI technology for a specific purpose, how to compare the solution you have developed with other existing ones or how to report the results obtained in a structured test.
Machine Learning Crash Course
- Taught by: Google
- Duration: 15 hours
- Idioma: English
- Price: Free
Through this course you will learn some key concepts such as the detailed study of machine learning and you will take your first steps with the TensorFlow API, among others.
To attend this course, it is recommended: some programming experience (preferably in Python), basic knowledge of machine learning, statistics, linear algebra and calculus.
Machine Learning
- Taught by: Coursera (Stanford)
- Duration:: 60 hours
- Language: English (English subtitles)
- Price: Free (47€ if you wish to apply for a certificate)
This is a MOOC on machine learning created by Andrew Ng, founder of the Google Brainproject in 2011 and the online course platform Coursera.
Through this course you will cover topics such as supervised and unsupervised learning, statistical pattern recognition or the application of 'best practices' in this field. In addition, you will also learn how to apply learning algorithms to the construction of intelligent robots, among many other aspects.
Masters
The current training offer on artificial intelligence does not only come in the form of courses. An increasing number of universities and study centres are offering their students specialised programmes and university master's degrees related to the field of AI. Here are just a few examples:
- Official Master's Degree in Computer Security and AI, Rovira i Virgili University (60 ECTS credits, one academic year): its programme covers research topics related to information protection, application security, machine learning, modelling and problem solving, among others.
- University Master's Degree in Artificial Intelligence, University of Santiago de Compostela (USC) (90 ECTS credits, 18 months): it offers students the possibility of broadening their knowledge in areas such as natural language processing, robotics, AI fundamentals or data engineering.
- Master's Degree in Intelligent Systems and Numerical Applications in Engineering, University of Las Palmas de Gran Canaria (ULPGC) (60 ECTS credits, 1 academic year): it introduces students to the bases and fundamentals of some leading areas such as computational modelling and numerical simulation of engineering problems, the use and development of intelligent and autonomous systems, or methods of data analysis and interpretation.
- Master in Artificial Intelligence, Universitat Politécnica de Catalunya (90 ECTS credits, 18 months): it offers a solid foundation and advanced knowledge in artificial intelligence. In this master's degree you will learn key concepts in computational intelligence, computer vision and multi-agent systems.
- Master's Degree in Applied Artificial Intelligence, Universidad Carlos III Madrid (60 ECTS credits, 1 academic year): it allows students to understand the most relevant AI methods and techniques and apply them to develop appropriate solutions to different types of problems.
- Master's Degree in Artificial Intelligence, UNIR (60 ECTS credits, 1 academic year): in this master's degree you will learn techniques of computational perception and artificial vision, automatic reasoning and planning, machine learning and deep learning, Natural Language Processing, as well as the technologies needed to implement them.
- Master's Degree in AI Research, Spanish Association for Artificial Intelligence (AEPIA) (60 ECTS credits, one academic year): it has three specialisations: Learning and Data Science, Web Intelligence and Reasoning and Planning.
- Master in Artificial Intelligence, Universidad Europea (30 ECTS credits, 8 months): aimed at providing students with an integrated vision of Artificial Intelligence and the mastery of advanced Machine Learning and Computational Optimisation techniques.
This has been just a small compilation of training courses related to the field of artificial intelligence that we hope will be of interest to you. If you know of any other course or master's degree that you would like to recommend, do not hesitate to leave us a comment or send us an email to dinamizacion@datos.gob.es.
Entrevista
The AMETIC association represents companies of all sizes linked to the Spanish digital technology industry, a key sector for the national GDP. Among other issues, AMETIC seeks to promote a favorable environment for the growth of companies in the sector, promoting digital talent and the creation and consolidation of new companies.
At datos.gob.es we spoke with Antonio Cimorra, Director of Digital Transformation and Enabling Technologies at AMETIC, to reflect on the role of open data in innovation and as the basis for new products, services and even business models.
Full interview:
1. How does open data help drive digital transformation? What disruptive technologies are the most benefited by the opening of data?
Open data is one of the pillars of the data economy , which is called to be the basis of our present and future development and the digital transformation of our society. All industries, public administrations and citizens themselves have only just begun to discover and use the enormous potential and usefulness that the use of data brings to improving the competitiveness of companies, to the efficiency and improvement of services. of Public Administrations and to social relations and people's quality of life.
2. One of the areas in which they work from AMETIC is Artificial Intelligence and Big Data, among whose objectives is to promote the creation of public platforms for sharing open data. Could you explain to us what actions you are carrying out or have carried out for this?
At AMETIC we have an Artificial Intelligence and Big Data Commission in which the main companies that provide this technology participate . From this area, we work on the definition of initiatives and proposals that contribute to disseminating their knowledge among potential users, with the consequent advantages that their incorporation in the public and private sectors entails. Outstanding examples of actions in this area are the recent presentation of the AMETIC Artificial Intelligence Observatory, as well as the AMETIC Artificial Intelligence Summit. which in 2022 will celebrate its fifth edition that will focus on showing how Artificial Intelligence can contribute to meeting the Sustainable Development Goals and the Transformation Plans to be executed with European Funds
3. Open data can serve as a basis for developing services and solutions that give rise to new companies . Could you tell us an example of a use case carried out by your partners?
Open data, and very particularly the reuse of public sector information, are the basis for the development of countless applications and entrepreneurial initiatives both in consolidated companies in our technology sector and in many other cases of small companies or startups found in this source of information the motor of development of new businesses and approach to the market.
4. What types of data are most in demand by the companies you represent?
At present, all industrial and social activity data are in great demand by companies , due to their great value in the development of projects and solutions that have been demonstrating their interest and extension in all areas and types of organizations and users. usually.
5. It is also essential to have data sharing initiatives such as GAIA-X , built on the values of digital sovereignty and data availability. How have companies received the creation of a national hub ?
The technology sector has received the creation of the GAIA-X national hub very positively, understanding that our contribution from Spain to this European project will be of enormous value to our companies from very different fields of activity. Data sharing spaces in sectors such as tourism, health, mobility, industry, to give a few examples, have Spanish companies and experiences that are an example and a reference at European and global level .
6. Right now there is a great demand for professionals related to data collection, analysis and visualization. However, the supply of professionals, although it is growing, continues to be limited . What should be done to boost training in skills related to data and digitization?
The supply of technology professionals is one of the biggest problems for the development of our local industry and for the digital transformation of society. It is a difficulty that we can describe as historical, and that far from going less, every day there is a greater number of positions and profiles to cover. It is a worldwide problem that shows that there is no single or simple formula to solve it, but we can mention the importance of all social and professional agents developing joint and collaborative actions that allow the digital training of our population from an early age. and cycles and specialized training and degree programs that are characterized by their proximity to what will be the professional careers for which it is necessary to have the participation of the business sector
7. During the last years, you have been part of the jury of the different editions of the Aporta Challenge. How do you think these types of actions contribute to boosting data-driven businesses?
The Aporta Challenge has been an example of support and encouragement for the definition of many projects around open data and for the development of its own industry that in recent years has been growing very significantly with the availability of data of very different groups, in many cases by the Public Administrations, and their subsequent reuse and incorporation into applications and solutions of interest to very different users.
Open data constitutes one of the pillars of the data economy, which is called to be the basis of our present and future development and of the digital transformation of our society.
8. What are the next actions that are going to be carried out in AMETIC linked to the data economy?
Among the most outstanding actions of AMETIC in relation to the data economy, it is worth mentioning our recent incorporation into the national hub of GAIA-X for which we have been elected members of its board of directors, and where we will represent and incorporate the vision and contributions of the digital technology industry in all the data spaces that are constituted , serving as a channel for the participation of the technology companies that carry out their activity in our country and that have to form the basis of the projects and use cases that integrate into the European network GAIA-X in collaboration with other national hubs.
Blog
Have you ever wondered how Alexa is able to recognise our voice and understand what we are saying (sometimes better than others)? Have you ever stopped to think about how Google is able to search for images similar to the one we are providing it with? You probably know that these techniques belong to the field of artificial intelligence. But don't be fooled, building these sophisticated models is only within the reach of a few. In this post we tell you why and what we ordinary mortals can do to train artificial intelligence models.
Introduction
In recent years we have witnessed incredible and surprising advances in the field of training Deep Learning models. On previous occasions we have cited the most relevant examples such as GPT-3 or Megatron-Turing NLG. These models, optimised for natural language processing (NLP), are capable of writing complete articles (practically indistinguishable from those written by a human) or making coherent summaries of classic works, hundreds of pages long, synthesising the content in just a few paragraphs. Impressive, isn't it?
However, these achievements are far from cheap. That is, the complexity of these models is such that thousands of gigabytes of pre-processed information - what we call annotated datasets - are needed, which have been previously analysed (labelled) by a human expert in the field. For example, the latest training of the Megatron-Turing NLG model, created in collaboration between Microsoft and NVIDIA, used 270 billion tokens (small pieces of text that can be words or sub-words that form the basis for training these natural language models). In addition to the information needed to be able to train these models, there is the fact of the special computational needs that these trainings require. To execute training tasks for these models, the most advanced machines (computers) in the world are needed, and training times are counted in weeks. Although there is no official data, some sources quote the cost of training the latest models such as GPT-3 or Megatron-Turing in the tens of millions of dollars. So how can we use and train models if we do not have access to the most powerful computing clusters in the world?
The answer: Transfer Learning
When working on a machine learning or deep learning project and we do not have access to large datasets ready for training, we can start from pre-trained models to create a new model adjusted or tuned to our specific use case. In other words, we load a previously trained model with a very large set of training data and re-train its final layers to fit our particular data set. This is known as Transfer Learning.
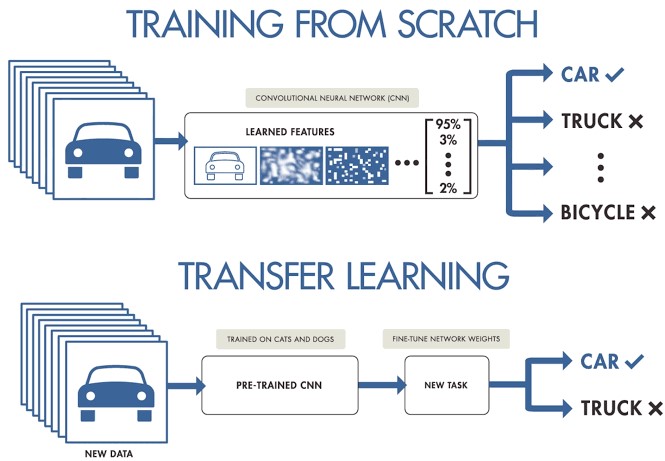
Original source: Transfer Learning in Deep Learning: Beyond our models. Post by Josu Alonso on Medium.
Simplifying a lot, we could say that traditional Machine Learning applies to isolated learning tasks, where it is not necessary to retain the acquired knowledge, while in a Transfer Learning project the learning is the result of previous tasks, achieving good precision in less time and with less data. This brings many opportunities, but also some challenges, such as the new domain inheriting biases from the previous domain.
Let's look at a concrete example. Suppose we have a new Deep Learning challenge and we want to make an automatic dog breed classifier. In this case, we can apply the transfer learning technique starting from a general image classification model, and then fit it to a specific set of dog breed photographs. Most of the pre-trained models are based on a subset of the ImageNet database, which we have already discussed on several occasions. The neural network (from ImageNet), which is the base type of algorithm used in these image classification models, has been trained on 1.2 million images of over 1000 different object categories such as keyboards, coffee cups, pencils and many animals. By using a pre-trained network to apply Transfer Learning, we get much faster and easier results than if we had to train a network from scratch.
For example, this code snippet shows the process of starting from a pre-trained model with ImageNet and re-training or adding new layers to achieve fine adjustments to the original model.
# we create the basis of the pre-trained model starting from ImageNET
base_model <- application_inception_v3(weights = 'imagenet', include_top = FALSE)
# We add additional layers to our neural network
predictions <- base_model$output %>%
layer_global_average_pooling_2d() %>%
layer_dense(units = 1024, activation = 'relu') %>%
layer_dense(units = 200, activation = 'softmax')
# we create a new model for training
model <- keras_model(inputs = base_model$input, outputs = predictions)
# We make sure to train only our new layers so as not to destroy previous training
freeze_weights(base_model)
# we compile the model
model %>% compile(optimizer = 'rmsprop', loss = 'categorical_crossentropy')
# we train the model
model %>% fit_generator(...)
Conclusions
Training a general-purpose deep learning model is not within everyone's reach. There are several barriers, from the difficulty of accessing quality training data in sufficient volume, to the computational capacity needed to process billions of images or texts. For more limited use cases, where we only require a refinement of generalist models, applying the Transfer Learning technique allows us to achieve fantastic results in terms of accuracy and training time, at a cost that is affordable for most data scientists. Transfer Learning applications are very numerous and specialised websites are full of application examples. In line with this trend, Style Transfer Learning, which consists of reconstructing images based on the style of a previous image, has recently become very popular. We will continue to discuss this topic in future posts.

Example of Style Transfer Learning in Kaggle
[1] It is not the purpose of this post to explain in detail each of the sections of this code snippet.
Content prepared by Alejandro Alija, expert in Digital Transformation and Innovation.
The contents and views expressed in this publication are the sole responsibility of the author.
Blog
Today, Artificial Intelligence (AI) applications are present in many areas of everyday life, from smart TVs and speakers that are able to understand what we ask them to do, to recommendation systems that offer us services and products adapted to our preferences.
These AIs "learn" thanks to various techniques, including supervised, unsupervised and reinforcement learning. In this article we will focus on reinforcement learning, which focuses mainly on trial and error, similar to how humans and animals in general learn.
The key to this type of system is to correctly set long-term goals in order to find an optimal global solution, without focusing too much on immediate rewards, which do not allow for an adequate exploration of the set of possible solutions.
Simulation environments as a complement to open data sets.
Unlike other types of learning, where learning is usually based on historical datasets, this type of technique requires simulation environments that allow training a virtual agent through its interaction with an environment, where it receives rewards or penalties depending on the state and actions it performs. This cycle between agent and environment can be seen in the following diagram:
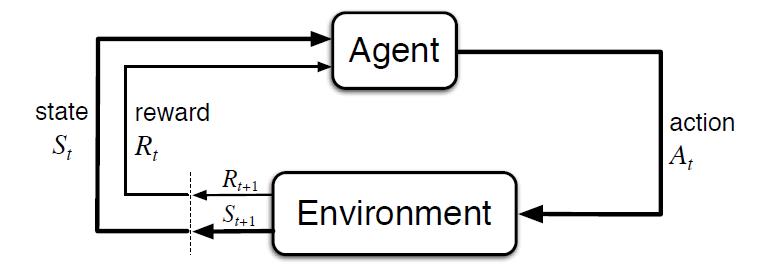
Figure 1 - Scheme of learning by reinforcement [Sutton & Barto, 2015]
That is, starting from a simulated environment, with an initial state, the agent performs an action that generates a new state and a possible reward or penalty, which depends on the previous states and the action performed. The agent learns the best strategy in this simulated environment from experience, exploring the set of states, and being able to recommend the best action policy if configured appropriately.
The best-known example worldwide was the success achieved by AlphaGo, beating 18-time world champion Lee Sedol in 2016. Go is an ancient game, considered one of the 4 basic arts in Chinese culture, along with music, painting and calligraphy. Unlike chess, the number of possible game combinations is greater than the number of atoms in the Universe, being a problem impossible to solve by traditional algorithms.
Curiously, the technological breakthrough demonstrated by AlphaGo in solving a problem that was claimed to be beyond the reach of an AI, was eclipsed a year later by its successor AlphaGo Zero. In this version, its creators chose not to use historical data or heuristic rules. AlphaGo Zero only uses the board positions and learns by trial and error by playing against itself.
Following this innovative learning strategy, in 3 days of execution he managed to beat AlphaGo, and after 40 days he became the best Go player, accumulating thousands of years of knowledge in a matter of days, and even discovering previously unknown strategies.
The impact of this technological milestone covers countless areas, and AI solutions that learn to solve complex problems from experience can be counted on. From resource management, strategy planning, or the calibration and optimization of dynamic systems.
The development of solutions in this area is especially limited by the need for appropriate simulation environments, being the most complex component to build. However, there are multiple repositories to obtain open simulation environments that allow us to test this type of solutions.
The best known reference is Open AI Gym, which includes an extensive set of libraries and open simulation environments for the development and validation of reinforcement learning algorithms. Among others, it includes simulators for the basic control of mechanical elements, robotics applications and physics simulators, two-dimensional ATARI video games, and even the landing of a lunar module. In addition, it allows to integrate and publish new open simulators for the development of our own simulators adapted to our needs that can be shared with the community:
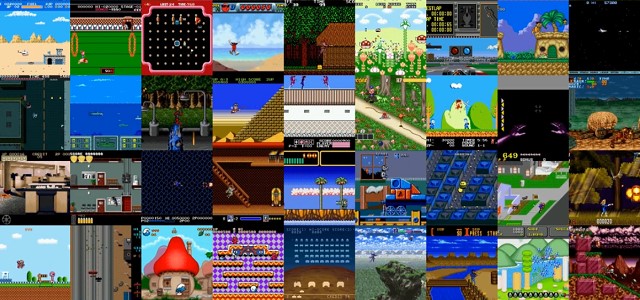
Figure 2 - Examples of visual simulation environments offered by Open AI Gym
Another interesting reference is Unity ML Agents, where we also find multiple libraries and several simulation environments, also offering the possibility of integrating our own simulator:
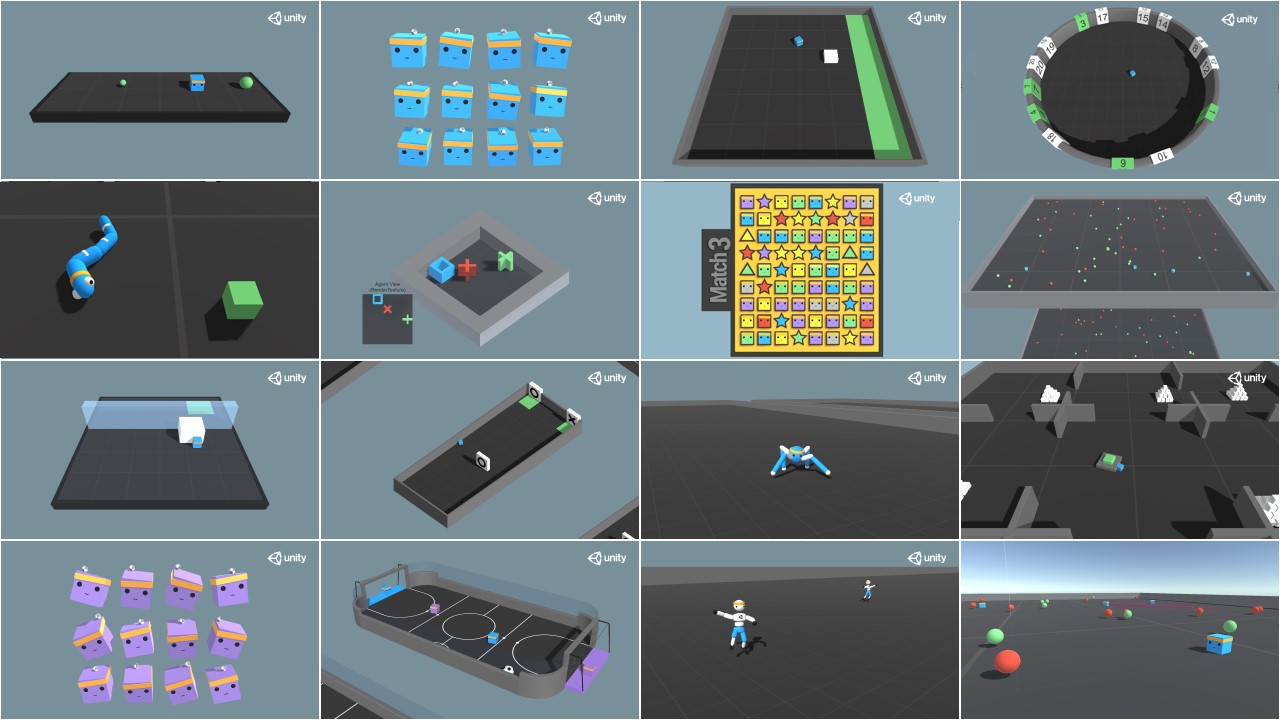
Figure 3 - Examples of visual simulation environments offered by Unity ML Agents
Potential applications of reinforcement learning in public administrations
This type of learning is used especially in areas such as robotics, resource optimization or control systems, allowing the definition of optimal policies or strategies for action in specific environments.
One of the best-known practical examples is the DeepMind algorithm used by Google to reduce by 40% the energy consumption required to cool its data centers in 2016, achieving a significant reduction in energy consumption during use, as can be seen in the following graph (taken from the previous article):
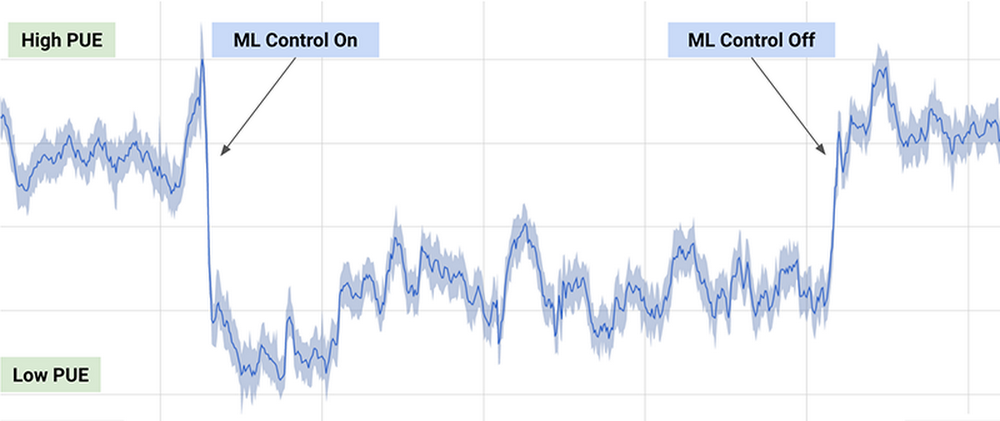
Figure 4 - Results of the DeepMind algorithm on the energy consumption of Google's data centers.
The algorithm employed uses a combination of deep learning and reinforcement learning techniques, together with a general purpose simulator to understand complex dynamic systems that could be applied in multiple environments such as transformation between energy types, water consumption or resource optimization in general.
Other possible applications in the public domain include the search and recommendation of open datasets through chatbots, or the optimization of public policies, as is the case of the European project Policy Cloud, applied for example in the analysis of future strategies of the different designations of origin of wines from Aragon.
In general, the application of this type of techniques could optimize the use of public resources by planning action policies that result in more sustainable consumption, reducing pollution, waste and public spending.
Content prepared by Jose Barranquero, expert in Data Science and Quantum Computing.
The contents and views expressed in this publication are the sole responsibility of the author.