Blog
The emergence of artificial intelligence (AI), and ChatGPT in particular, has become one of the main topics of debate in recent months. This tool has even eclipsed other emerging technologies that had gained prominence in a wide range of fields (legal, economic, social and cultural). This is the case, for example, of web 3.0, the metaverse, decentralised digital identity or NFTs and, in particular, cryptocurrencies.
There is an unquestionable direct relationship between this type of technology and the need for sufficient and appropriate data, and it is precisely this last qualitative dimension that justifies why open data is called upon to play a particularly important role. Although, at least for the time being, it is not possible to know how much open data provided by public sector entities is used by ChatGPT to train its model, there is no doubt that open data is a key to improving their performance.
Regulation on the use of data by AI
From a legal point of view, AI is arousing particular interest in terms of the guarantees that must be respected when it comes to its practical application. Thus, various initiatives are being promoted that seek to specifically regulate the conditions for its use, among which the proposal being processed by the European Union stands out, where data are the object of special attention.
At the state level, Law 15/2022, of 12 July, on equal treatment and non-discrimination, was approved a few months ago. This regulation requires public administrations to promote the implementation of mechanisms that include guarantees regarding the minimisation of bias, transparency and accountability, specifically with regard to the data used to train the algorithms used for decision-making.
There is a growing interest on the part of the autonomous communities in regulating the use of data by AI systems, in some cases reinforcing guarantees regarding transparency. Also, at the municipal level, protocols are being promoted for the implementation of AI in municipal services in which the guarantees applicable to the data, particularly from the perspective of their quality, are conceived as a priority requirement.
The possible collision with other rights and legal interests: the protection of personal data
Beyond regulatory initiatives, the use of data in this context has been the subject of particular attention as regards the legal conditions under which it is admissible. Thus, it may be the case that the data to be used are protected by third party rights that prevent - or at least hinder - their processing, such as intellectual property or, in particular, the protection of personal data. This concern is one of the main motivations for the European Union to promote the Data Governance Regulation, a regulation that proposes technical and organisational solutions that attempt to make the re-use of information compatible with respect for these legal rights.
Precisely, the possible collision with the right to the protection of personal data has motivated the main measures that have been adopted in Europe regarding the use of ChatGPT. In this regard, the Garante per la Protezione dei Dati Personali has ordered a precautionary measure to limit the processing of Italian citizens' data, the Spanish Data Protection Agency has initiated ex officio inspections of OpenAI as data controller and, with a supranational scope, the European Data Protection Supervisor (EDPB) has created a specific working group.
The impact of the regulation on open data and re-use
The Spanish regulation on open data and re-use of public sector information establishes some provisions that must be taken into account by IA systems. Thus, in general, re-use will be admissible if the data has been published without conditions or, in the event that conditions are set, when they comply with those established through licences or other legal instruments; although, when they are defined, the conditions must be objective, proportionate, non-discriminatory and justified by a public interest objective.
As regards the conditions for re-use of information provided by public sector bodies, the processing of such information is only allowed if the content is not altered and its meaning is not distorted, and the source of the data and the date of its most recent update must be mentioned.
On the other hand, high-value datasets are of particular interest for these AI systems characterised by the intense re-use of third-party content given the massive nature of the data processing they carry out and the immediacy of the requests for information made by users. Specifically, the conditions established by law for the provision of these high-value datasets by public bodies mean that there are very few limitations and also that their re-use is greatly facilitated by the fact that the data must be freely available, be susceptible to automated processing, be provided through APIs and be provided in the form of mass downloading, where appropriate.
In short, considering the particularities of this technology and, therefore, the very unique circumstances in which the data are processed, it seems appropriate that the licences and, in general, the conditions under which public entities allow their re-use be reviewed and, where appropriate, updated to meet the legal challenges that are beginning to arise.
Content prepared by Julián Valero, Professor at the University of Murcia and Coordinator of the "Innovation, Law and Technology" Research Group (iDerTec).
The contents and points of view reflected in this publication are the sole responsibility of the author.
Blog
In the process of analysing data and training machine learning models, it is essential to have an adequate dataset. Therefore, the questions arise: how should you prepare your datasets for machine learning and analytics, and how can you be confident that the data will lead to robust conclusions and accurate predictions?
The first thing to consider when preparing your data is to know the type of problem you are trying to solve. For example, if your intention is to create a machine learning model capable of recognising someone's emotional state from their facial expressions, you will need a dataset with images or videos of people's faces. Or, perhaps, the goal is to create a model that identifies unwanted emails. For this, you will need data in text format from emails.
Furthermore, the data required also depends on the type of algorithm you want to use. Supervised learning algorithms, such as linear regression or decision trees, require a field containing the true value of an outcome for the model to learn from. In addition to this true value, called the target, they require fields containing information about the observations, known as features. In contrast, unsupervised learning algorithms, such as k-means clustering or recommendation systems based on collaborative filtering, usually only need features.
However, finding the data is only half the job. Real-world datasets can contain all sorts of errors that can render all the work useless if they are not detected and corrected before starting. In this post, we'll introduce some of the main pitfalls that can be found in datasets for machine learning and analytics, as well as some ways in which the collaborative data science platform, Datalore, can help spot them quickly and remedy them.
Is the data representative of what you want to measure?
Most datasets for machine learning projects or analytics are not designed specifically for that purpose. In the absence of a metadata dictionary or an explanation of what the fields in the dataset mean, the user may have to figure out the unknown based on the information available to them.
One way to determine what features in a dataset measure is to check their relationships to other features. If two fields are assumed to measure similar things, one would expect them to be closely related. Conversely, if two domains measure very different things, you would expect them to be unrelated. These ideas are known as convergent and discriminant validity, respectively.
Another important thing to check is whether any of the traits are too closely related to the target audience. If this happens, it may indicate that this feature is accessing the same information as the target to be predicted. This phenomenon is known as feature leakage. If such data is used, there is a risk of artificially inflating the performance of the model.
In this sense, Datalore allows you to quickly scan the relationship between continuous variables by means of the correlation graph in the Visualise tab for a DataFrame. Another way to test these relationships is by using bar charts or cross tabulations, or effect size measures such as the coefficient of determination or Cramer's V.
Is the dataset properly filtered and cleaned?
Datasets can contain all kinds of inconsistencies that can negatively affect our models or analyses. Some of the most important indicators of dirty data are:
- Implausible values: This includes values that are out of range, such as negatives in a count variable or frequencies that are much higher or lower than expected for a particular field.
- Outliers: These are extreme values, which can represent anything from coding errors that occurred at the time the data were written, to rare but real values that lie outside the bulk of the other observations.
- Missing values: The pattern and amount of missing data determines the impact it will have, the most serious being those related to the target or features.
Dirty data can undermine the quality of your analyses and models, largely because it distorts conclusions or leads to poor model performance. Datalore's Statistics tab makes it easy to check for these problems by showing at a glance the distribution, the number of missing values and the presence of outliers for each field. Datalore also facilitates the exploration of the raw data and allows to perform basic filtering, sorting and column selection operations directly in a DataFrame, exporting the Python code corresponding to each action to a new cell.
Are the variables balanced?
Unbalanced data occur when categorical fields have an uneven distribution of observations across all classes. This situation can cause significant problems for models and analyses. When you have a very unbalanced target, you can create lazy models that can still achieve good performance by simply predicting the majority class by default. Let's take an extreme example: we have a dataset where 90% of the observations fall into one of the target classes and 10% fall into the other. If we always predicted the majority class for this dataset, we would still get an accuracy of 90%, which shows that, in these cases, a model that learns nothing from the features can perform excellently.
Features are also affected by class imbalance. Models work by learning patterns, and when classes are too small, it is difficult for models to make predictions for these groups. These effects can be exacerbated when you have several unbalanced features, leading to situations where a particular combination of rare classes can only occur in a handful of observations.
Unbalanced data can be rectified by various sampling techniques. Undersampling involves reducing the number of observations in the larger classes to equalise the distribution of the data, and oversampling involves creating more data in the smaller classes. There are many ways to do this. Examples include using Python packages such as imbalanced-learn or services such as Gretel. Unbalanced features can also be corrected by feature engineering, which aims to combine classes within a field without losing information.
In short, is the dataset representative?
When creating a dataset, you have in mind a target group for which you want your model or analysis to work. For example, a model to predict the likelihood that American men interested in fashion will buy a certain brand. This target group is the population you want to be able to make generalisations about. However, as it is often impractical to collect information on all individuals who constitute this part of the population, a subset called a sample is used instead.
Sometimes problems arise that cause the sample data for the machine learning model and analysis to misrepresent the behaviour of the population. This is called data bias. For example, the sample may not capture all subgroups of the population, a type of bias called selection bias.
One way to check for bias is to inspect the distribution of the fields in your data and check that they make sense based on what you know about that population group. Using Datalore's Statistics tab allows you to scan the distribution of continuous and categorical variables in a DataFrame.
Is the actual performance of the models being measured?
A final issue that can put you in a bind is measuring the performance of your models. Many models are prone to a problem called overfitting which is when the model fits the training data so well that it does not generalise well to new data. The telltale sign of overfitting is a model that performs extremely well on training data and underperforms on new data. The way to account for this is to split the dataset into several sets: a training set to train the model, a validation set to compare the performance of different models, and a final test set to check how the model will perform in the real world.
However, creating a clean training-validation-testing split can be tricky. A major problem is data leakage, whereby information from the other two datasets leaks into the training set. This can lead to problems ranging from the obvious, such as duplicate observations ending up in all three datasets, to more subtle ones, such as using information from the entire dataset to perform feature pre-processing before splitting the data. In addition, it is important that the three datasets have the same distribution of targets and features, so that each is a representative sample of the population.
To avoid any problems, you should split the dataset into training, validation and test sets at the beginning of your work, prior to any exploration or processing. To ensure that each dataset has the same distribution of each field, you can use a method such as scikit-learn's train_test_split, which is specifically designed to create representative splits of the data. Finally, it is advisable to compare the descriptive statistics of each dataset to check for signs of data leakage or uneven splits, which is easily done using the Statistics tab in Datalore.
Ultimately, there are a number of issues that can occur when preparing data for machine learning and analytics and it is important to know how to mitigate them. While this can be a time-consuming part of the work process, there are tools that can make it quicker and easier to spot problems at an early stage.
Content drawn from Jodie Burchell's post How to prepare your dataset for machine learning and analysis published in The JetBrains Datalore Blog
Blog
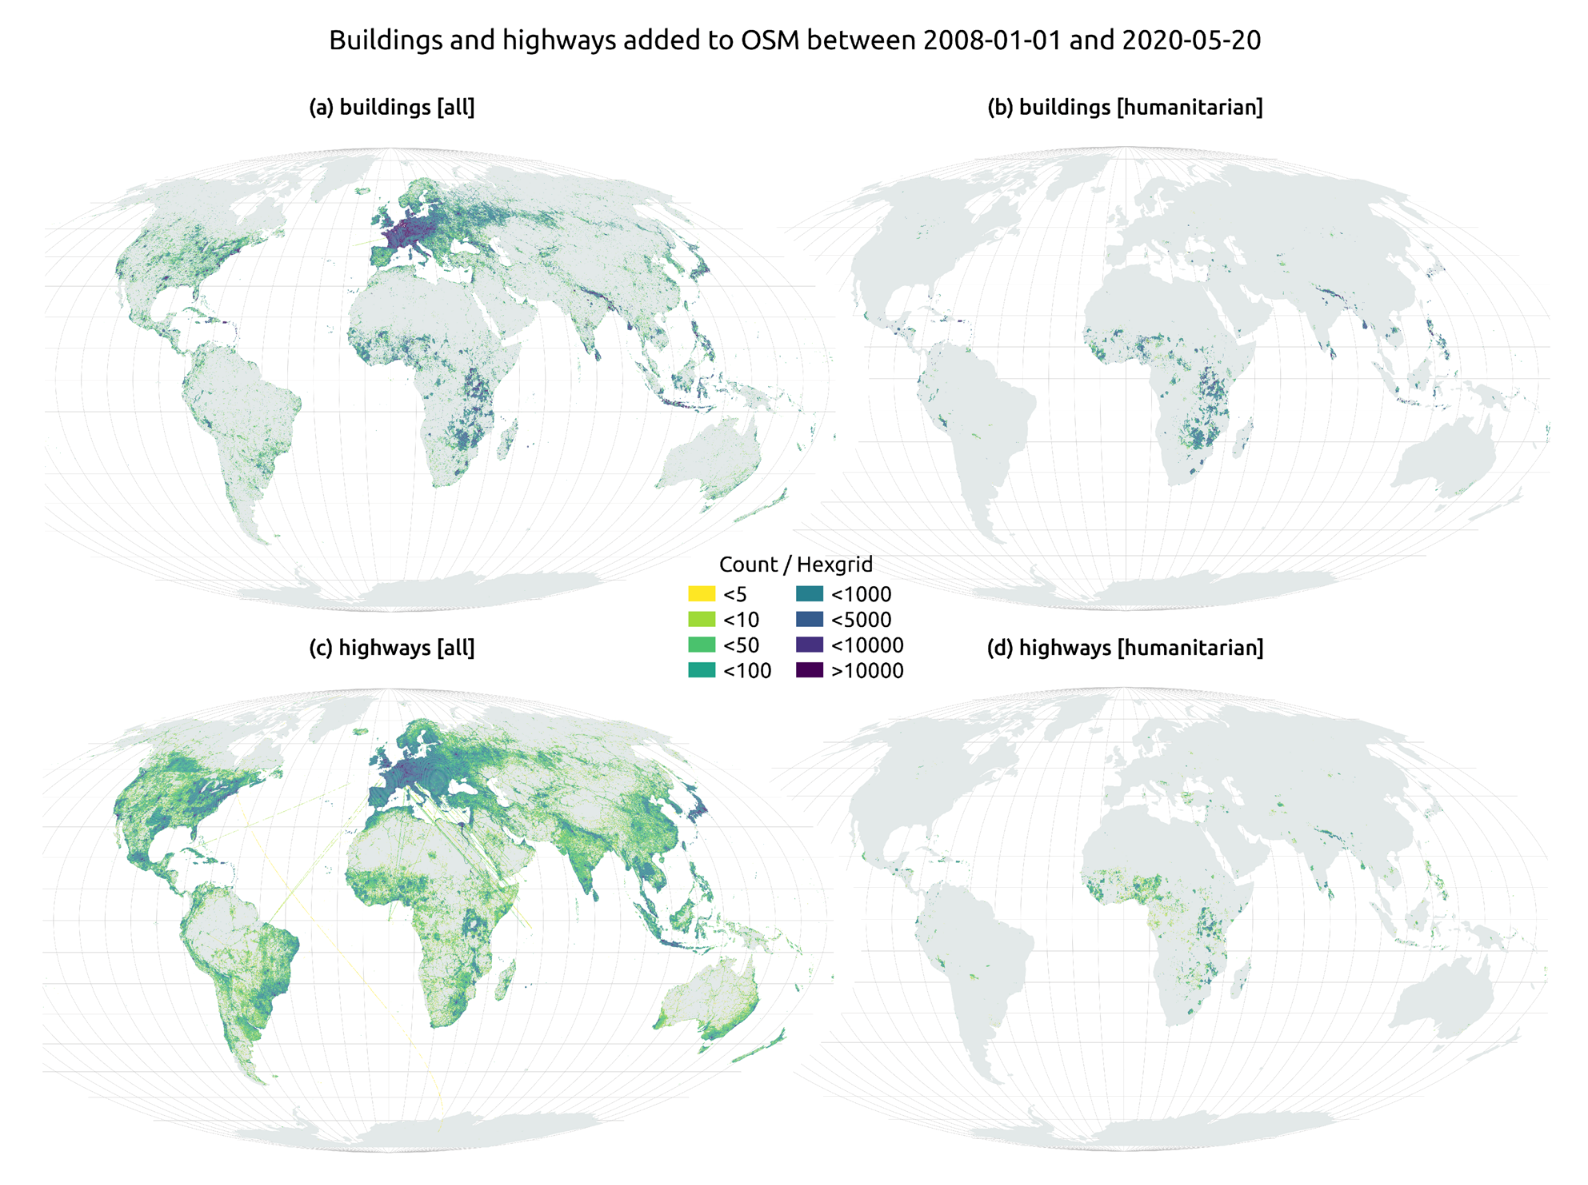
The humanitarian crisis following the earthquake in Haiti in 2010 was the starting point for a voluntary initiative to create maps to identify the level of damage and vulnerability by areas, and thus to coordinate emergency teams. Since then, the collaborative mapping project known as Hot OSM (OpenStreetMap) has played a key role in crisis situations and natural disasters.
Now, the organisation has evolved into a global network of volunteers who contribute their online mapping skills to help in crisis situations around the world. The initiative is an example of data-driven collaboration to solve societal problems, a theme we explore in this data.gob.es report.
Hot OSM works to accelerate data-driven collaboration with humanitarian and governmental organisations, as well as local communities and volunteers around the world, to provide accurate and detailed maps of areas affected by natural disasters or humanitarian crises. These maps are used to help coordinate emergency response, identify needs and plan for recovery.
In its work, Hot OSM prioritises collaboration and empowerment of local communities. The organisation works to ensure that people living in affected areas have a voice and power in the mapping process. This means that Hot OSM works closely with local communities to ensure that areas important to them are mapped. In this way, the needs of communities are considered when planning emergency response and recovery.
Hot OSM's educational work
In addition to its work in crisis situations, Hot OSM is dedicated to promoting access to free and open geospatial data, and works in collaboration with other organisations to build tools and technologies that enable communities around the world to harness the power of collaborative mapping.
Through its online platform, Hot OSM provides free access to a wide range of tools and resources to help volunteers learn and participate in collaborative mapping. The organisation also offers training for those interested in contributing to its work.
One example of a HOT project is the work the organisation carried out in the context of Ebola in West Africa. In 2014, an Ebola outbreak affected several West African countries, including Sierra Leone, Liberia and Guinea. The lack of accurate and detailed maps in these areas made it difficult to coordinate the emergency response.
In response to this need, HOT initiated a collaborative mapping project involving more than 3,000 volunteers worldwide. Volunteers used online tools to map Ebola-affected areas, including roads, villages and treatment centres.
This mapping allowed humanitarian workers to better coordinate the emergency response, identify high-risk areas and prioritize resource allocation. In addition, the project also helped local communities to better understand the situation and participate in the emergency response.
This case in West Africa is just one example of HOT's work around the world to assist in humanitarian crisis situations. The organisation has worked in a variety of contexts, including earthquakes, floods and armed conflict, and has helped provide accurate and detailed maps for emergency response in each of these contexts.
On the other hand, the platform is also involved in areas where there is no map coverage, such as in many African countries. In these areas, humanitarian aid projects are often very challenging in the early stages, as it is very difficult to quantify what population is living in an area and where they are located. Having the location of these people and showing access routes "puts them on the map" and allows them to gain access to resources.
In this article The evolution of humanitarian mapping within the OpenStreetMap community by Nature, we can see graphically some of the achievements of the platform.
How to collaborate
It is easy to start collaborating with Hot OSM, just go to https://tasks.hotosm.org/explore and see the open projects that need collaboration.
This screen allows us a lot of options when searching for projects, selected by level of difficulty, organisation, location or interests among others.
To participate, simply click on the Register button.
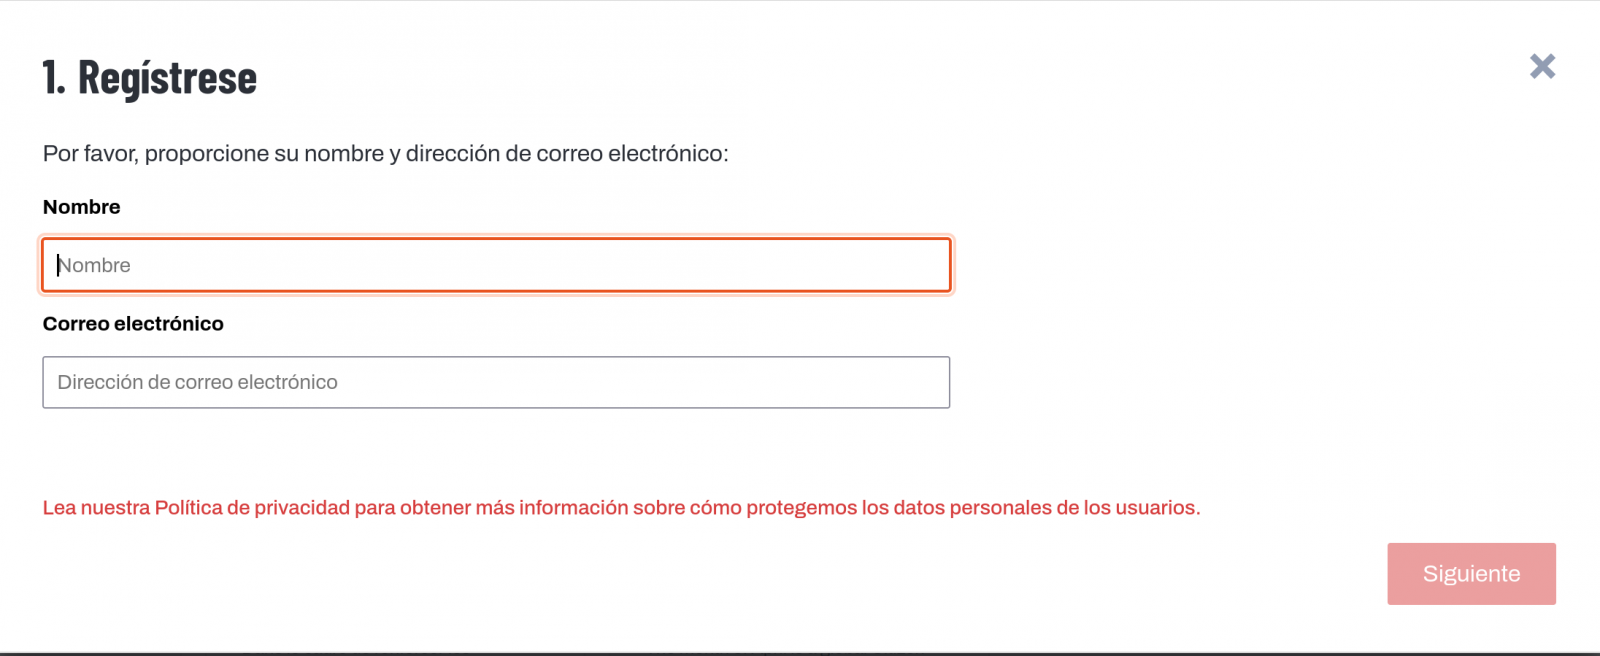
Give a name and an e-mail adress on the next screen:
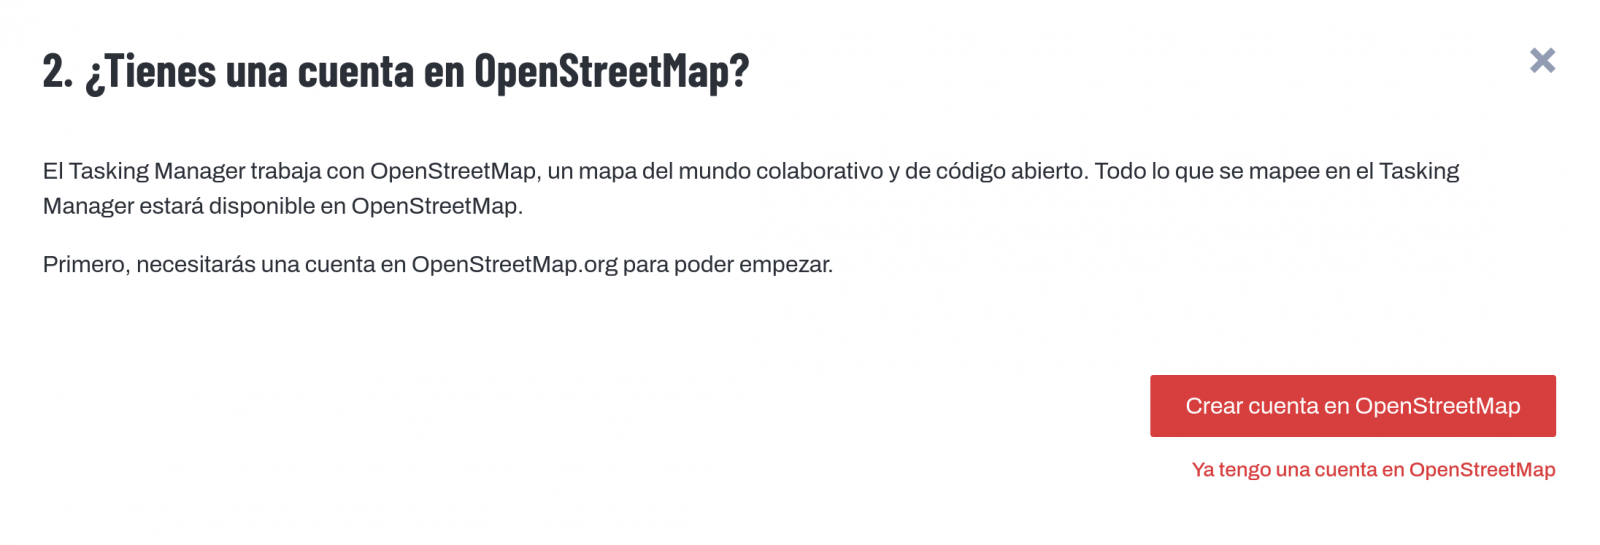
It will ask us if we have already created an account in Open Street Maps or if we want to create one.
If we want to see the process in more detail, this website makes it very easy.
Once the user has been created, on the learning page we find help on how to participate in the project.
It is important to note that the contributions of the volunteers are reviewed and validated and there is a second level of volunteers, the validators, who validate the work of the beginners. During the development of the tool, the HOT team has taken great care to make it a user-friendly application so as not to limit its use to people with computer skills.
In addition, organisations such as the Red Cross and the United Nations regularly organise mapathons to bring together groups of people for specific projects or to teach new volunteers how to use the tool. These meetings serve, above all, to remove the new users' fear of "breaking something" and to allow them to see how their voluntary work serves concrete purposes and helps other people.
Another of the project's great strengths is that it is based on free software and allows for its reuse. In the MissingMaps project's Github repository we can find the code and if we want to create a community based on the software, the Missing Maps organisation facilitates the process and gives visibility to our group.
In short, Hot OSM is a citizen science and data altruism project that contributes to bringing benefits to society through the development of collaborative maps that are very useful in emergency situations. This type of initiative is aligned with the European concept of data governance that seeks to encourage altruism to voluntarily facilitate the use of data for the common good.
Content by Santiago Mota, senior data scientist.
The contents and views reflected in this publication are the sole responsibility of the author.
Blog
We continue with the series of posts about Chat GPT-3. The expectation raised by the conversational system more than justifies the publication of several articles about its features and applications. In this post, we take a closer look at one of the latest news published by openAI related to Chat GPT-3. In this case, we introduce its API, that is, its programming interface with which we can integrate Chat GPT-3 into our own applications.
Introduction.
In our last post about Chat GPT-3 we carried out a co-programming or assisted programming exercise in which we asked the AI to write us a simple program, in R programming language, to visualise a set of data. As we saw in the post, we used Chat GTP-3's own available interface. The interface is very minimalistic and functional, we just have to ask the AI in the text box and it answers us in the subsequent text box. As we concluded in the post, the result of the exercise was more than satisfactory. However, we also detected some points for improvement. For example, the standard interface can be a bit slow. For a long exercise, with multiple conversational interactions with the AI (a long dialogue), the interface takes quite a long time to write the answers. Several users report the same feeling and so some, like this developer, have created their own interface with the conversational assistant to improve its response speed.
But how is this possible? The reason is simple, thanks to the GPT-3 Chat API. We have talked a lot about APIs in this space in the past. Not surprisingly, APIs are the standard mechanisms in the world of digital technologies for integrating services and applications. Any app on our smartphone makes use of APIs to show us results. When we consult the weather, sports results or the public transport timetable, apps make calls to the APIs of the services to consult the information and display the results.
The GPT-3 Chat API
Like any other current service, openAI provides its users with an API with which they can invoke (call) its different services based on the trained natural language model GPT-3. To use the API, we just have to log in with our account at https://platform.openai.com/ and locate the menu (top right) View API Keys. Click on create a new secret key and we have our new access key to the service.

What do we do now? Well, to illustrate what we can do with this brand new key, let's look at some examples:
As we said in the introduction, we may want to try alternative interfaces to Chat GPT-3 such as https://www.typingmind.com/. When we access this website, the first thing we have to do is enter our API Key.
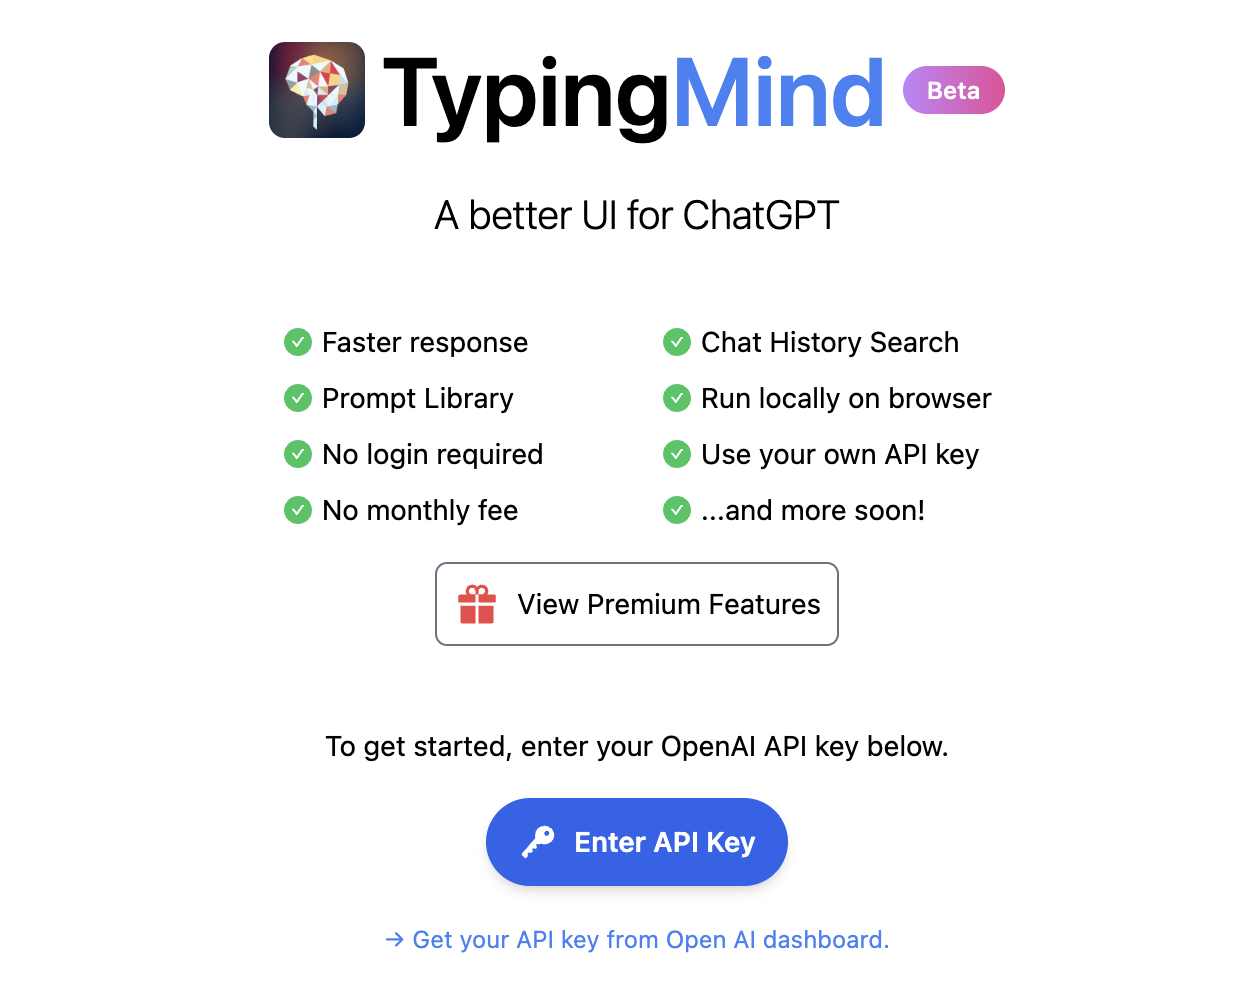
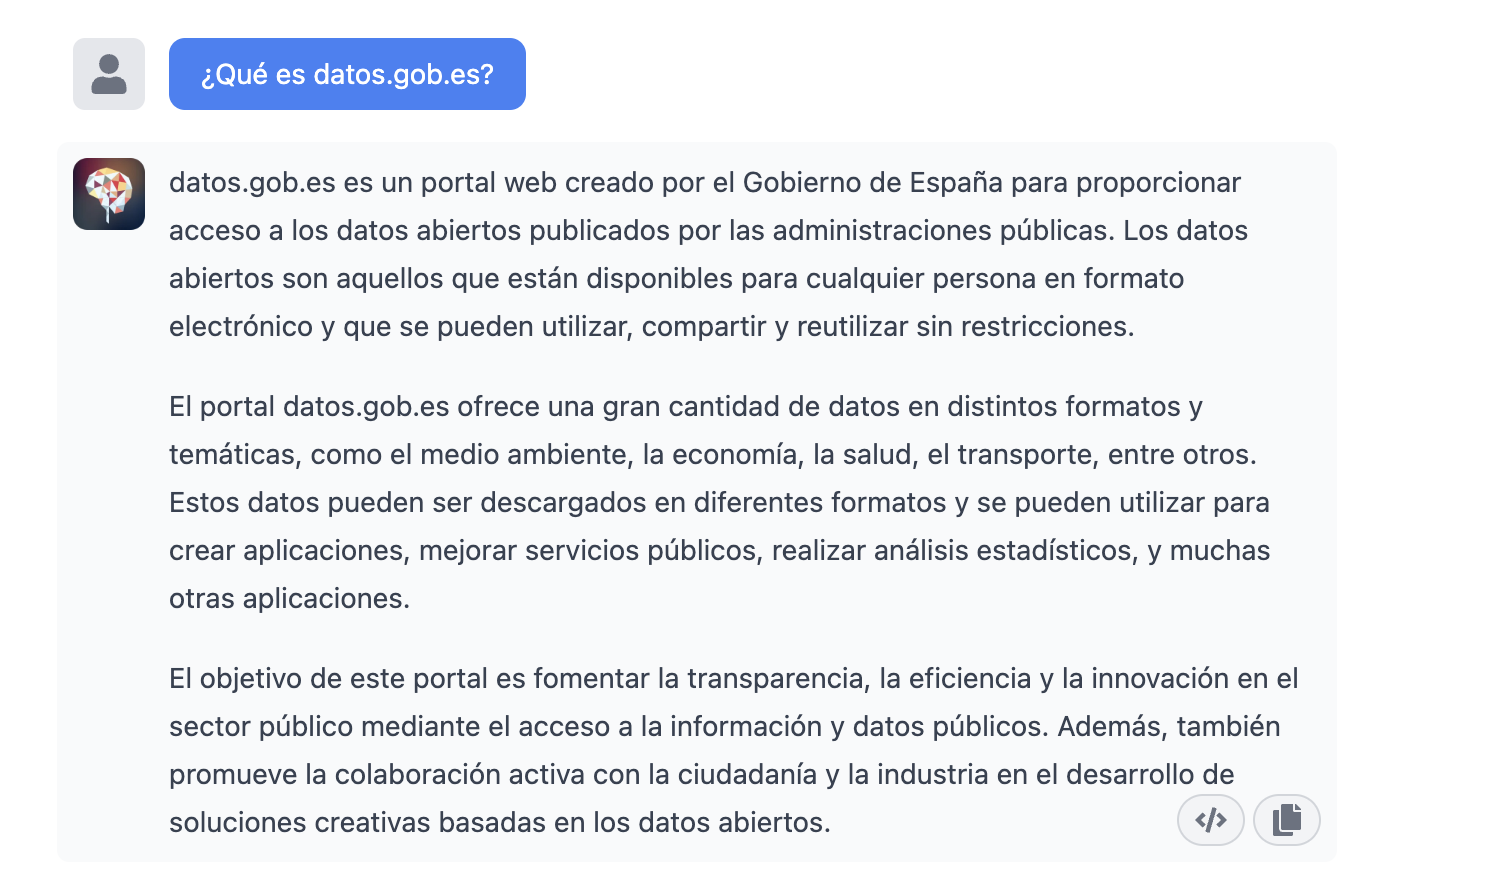
Once inside, let's do an example and see how this new interface behaves. Let's ask Chat GPT-3 What is datos.gob.es?
| Note: It is important to note that most services will not work if we do not activate a means of payment on the OpenAI website. Normally, if we have not configured a credit card, the API calls will return an error message similar to \"You exceeded your current quota, please check your plan and billing details\". |
Let's now look at another application of the GPT-3 Chat API.
Programmatic access with R to access Chat GPT-3 programmatically (in other words, with a few lines of code in R we have access to the conversational power of the GPT-3 model). This demonstration is based on the recent post published in R Bloggers. Let's access Chat GPT-3 programmatically with the following example.
| Note: Note that the API Key has been hidden for security and privacy reasons. |

En este ejemplo, utilizamos código en R para hacer una llamada HTTPs de tipo POST y le preguntamos a Chat GPT-3 ¿Qué es datos.gob.es? Vemos que estamos utilizando el modelo gpt-3.5-turbo que, tal y como se especifica en la documentación está indicado para tareas de tipo conversacional. Toda la información sobre la API y los diferentes modelos está disponible aquí. Pero, veamos el resultado:
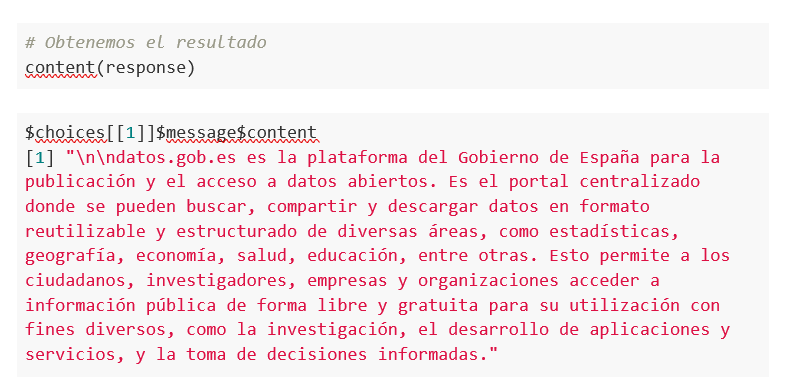
Not bad, right? As a curious fact we can see that a few GPT-3 Chat API calls have had the following API usage:

The use of the API is priced per token (something similar to words) and the public prices can be consulted here. Specifically, the model we are using has these prices: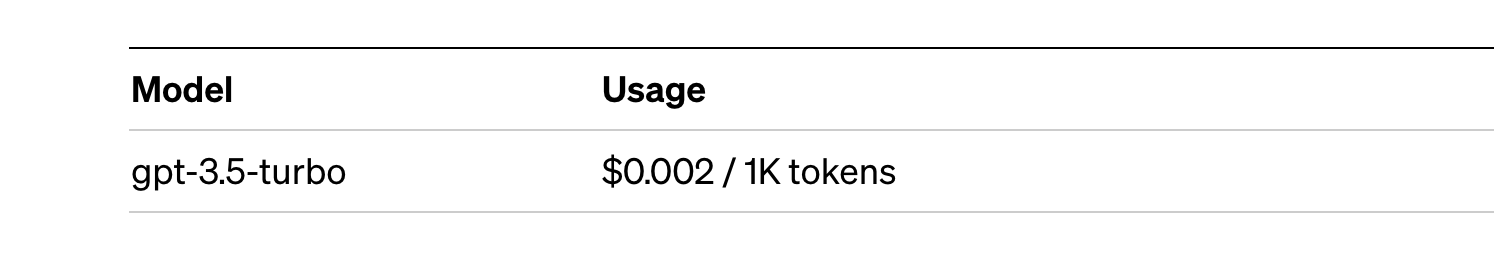
For small tests and examples, we can afford it. In the case of enterprise applications for production environments, there is a premium model that allows you to control costs without being so dependent on usage.
Conclusion
Naturally, Chat GPT-3 enables an API to provide programmatic access to its conversational engine. This mechanism allows the integration of applications and systems (i.e. everything that is not human) opening the door to the definitive take-off of Chat GPT-3 as a business model. Thanks to this mechanism, the Bing search engine now integrates GPT-3 Chat for conversational search responses. Similarly, Microsoft Azure has just announced the availability of GPT-3 Chat as a new public cloud service. No doubt in the coming weeks we will see communications from all kinds of applications, apps and services, known and unknown, announcing their integration with GPT-3 Chat to improve conversational interfaces with their customers. See you in the next episode, maybe with GPT-4.
Blog
Behind a voice-enabled virtual assistant, a movie recommendation on a streaming platform, or the development of some COVID-19 vaccines, there are machine learning models. This branch of artificial intelligence enables systems to learn and improve their performance.
Machine learning (ML) is one of the fields driving technological progress today, and its applications are growing every day. Examples of solutions developed with machine learning include DALL-E, the set of language models in Spanish known as MarIA, and even Chat GPT-3, a generative AI tool capable of creating content of all types, such as code for programming data visualizations from the datos.gob.es catalog.
All of these solutions work thanks to large data repositories that make system learning possible. Among these, open data plays a fundamental role in the development of artificial intelligence as it can be used to train machine learning models.
Based on this premise, along with the ongoing effort of governments to open up data, there are non-governmental organizations and associations that contribute by developing applications that use machine learning techniques aimed at improving the lives of citizens. We highlight three of them:
ML Commons is driving a better machine learning system for everyone
This initiative aims to improve the positive impact of machine learning on society and accelerate innovation by offering tools such as open datasets, best practices, and algorithms. Its founding members include companies such as Google, Microsoft, DELL, Intel AI, Facebook AI, among others.
According to ML Commons, around 80% of research in the field of machine learning is based on open data. Therefore, open data is vital to accelerate innovation in this field. However, nowadays, "most public data files available are small, static, legally restricted, and not redistributable," as David Kanter, director of ML Commons, assures.
In this regard, innovative ML technologies require large datasets with licenses that allow their reuse, that can be redistributed, and that are continually improving. Therefore, ML Commons' mission is to help mitigate that gap and thus promote innovation in machine learning.
The main goal of this organization is to create a community of open data for the development of machine learning applications. Its strategy is based on three pillars:
Firstly, creating and maintaining comprehensive open datasets, including The People's Speech, with over 30,000 hours of speech in English to train natural language processing (NLP) models, Multilingual Spoken Words, with over 23 million expressions in 50 different languages, or Dollar Street, with over 38,000 images of homes from around the world in various socio-economic situations. The second pillar involves promoting best practices that facilitate standardization, such as the MLCube project, which proposes standardizing the container process for ML models to facilitate shared use. Lastly, benchmarking in study groups to define benchmarks for the developer and research community.
Taking advantage of the benefits and being part of the ML Commons community is free for academic institutions and small companies (less than ten workers).
Datacommons synthesizes different sources of open data into a single portal
Datacommons aims to enhance democratic data flows within the cooperative and solidarity economy and its main objective is to offer purified, normalized, and interoperable data.
The variety of formats and information offered by public portals of open data can be a hindrance to research. The goal of Datacommons is to compile open data into an encyclopedic website that organizes all datasets through nodes. This way, users can access the source that interests them the most.
This platform, designed for educational and journalistic research purposes, functions as a reference tool for navigating through different sources of data. The team of collaborators works to keep the information up-to-date and interacts with the community through its email (support@datacommons.org) or GitHub forum.
Papers with Code: the open repository of materials to feed machine learning models
This is a portal that offers code, reports, data, methods, and evaluation tables in open and free format. All content on the website is licensed under CC-BY-SA, meaning it allows copying, distributing, displaying, and modifying the work, even for commercial purposes, by sharing the contributions made with the same original license.
Any user can contribute by providing content and even participate in the community's Slack channel, which is moderated by responsible individuals who protect the platform's defined inclusion policy.
As of today, Papers with Code hosts 7806 datasets that can be filtered by format (graph, text, image, tabular, etc.), task (object detection, queries, image classification, etc.), or language. The team maintaining Papers with Code belongs to the Meta Research Institute.
The goal of ML Commons, Data Commons, and Papers with Code is to maintain and grow open data communities that contribute to the development of innovative technologies, including artificial intelligence (machine learning, deep learning, etc.) with all the possibilities its development can offer to society.
As part of this process, the three organizations play a fundamental role: they offer standard and redistributable data repositories to train machine learning models. These are useful resources for academic exercises, promoting research, and ultimately facilitating the innovation of technologies that are increasingly present in our society.
Blog
Talking about GPT-3 these days is not the most original topic in the world, we know it. The entire technology community is publishing examples, holding events and predicting the end of the world of language and content generation as we know it today. In this post, we ask ChatGPT to help us in programming an example of data visualisation with R from an open dataset available at datos.gob.es.
Introduction
Our previous post talked about Dall-e and GPT-3's ability to generate synthetic images from a description of what we want to generate in natural language. In this new post, we have done a completely practical exercise in which we ask artificial intelligence to help us make a simple program in R that loads an open dataset and generates some graphical representations.
We have chosen an open dataset from the platform datos.gob.es. Specifically, a simple dataset of usage data from madrid.es portals. The description of the repository explains that it includes information related to users, sessions and number of page views of the following portals of the Madrid City Council: Municipal Web Portal, Sede Electrónica, Transparency Portal, Open Data Portal, Libraries and Decide Madrid.
The file can be downloaded in .csv or .xslx format and if we preview it, it looks as follows:

OK, let's start co-programming with ChatGPT!
First we access the website and log in with our username and password. You need to be registered on the openai.com website to be able to access GPT-3 capabilities, including ChatGPT.
We start our conversation:

During this exercise we have tried to have a conversation in the same way as we would have with a programming partner. So the first step we do is to say ‘hello’ and mention the problem we have. When we ask the AI to help us create a small program in R that graphically represents some data, it gives us some examples and helps us with the explanation of the program:

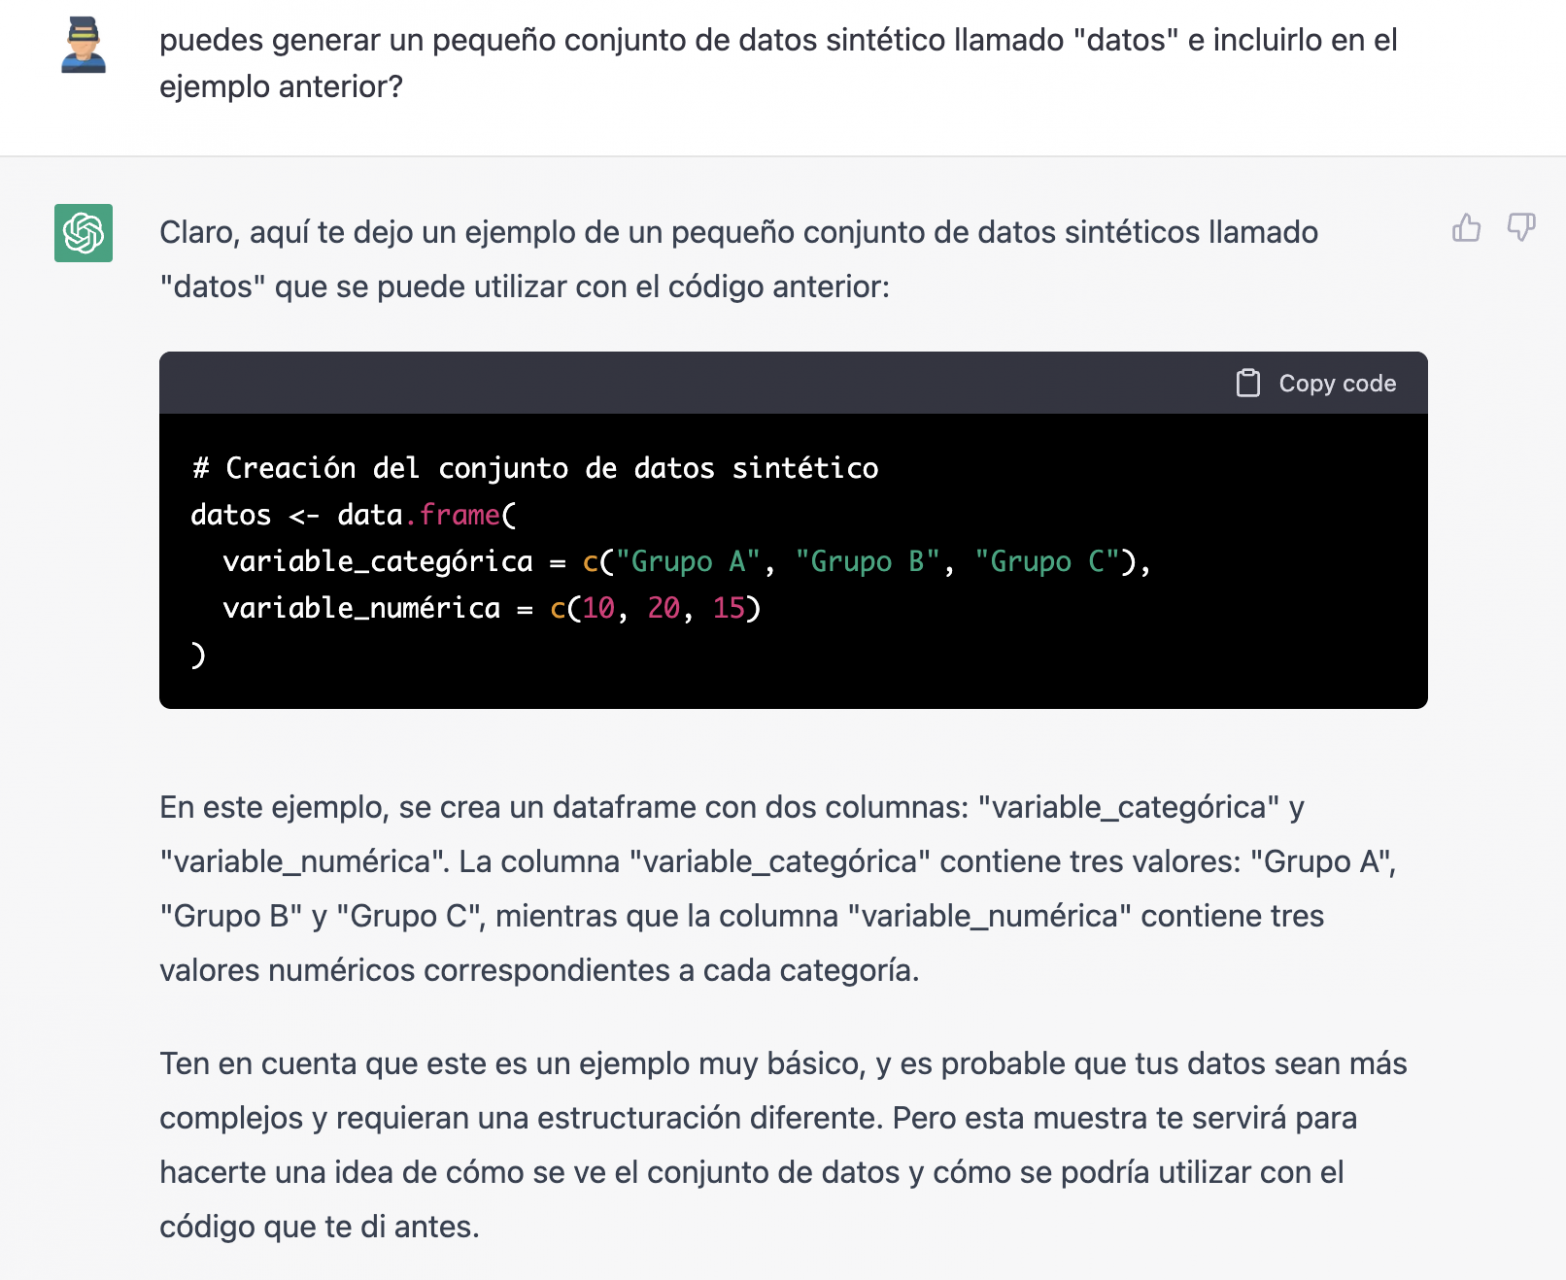
Since we have no data, we cannot do anything practical at the moment, so we ask it to help us generate some synthetic data.
As we say, we behave with the AI as we would with a person (it looks good).

Once the AI seems to easily answer our questions, we go to the next step, we are going to give it the data. And here the magic begins... We have opened the data file that we have downloaded from datos.gob.es and we have copied and pasted a sample.
| Note: ChatGPT has no internet connection and therefore cannot access external data, so all we can do is give it an example of the actual data we want to work with. |
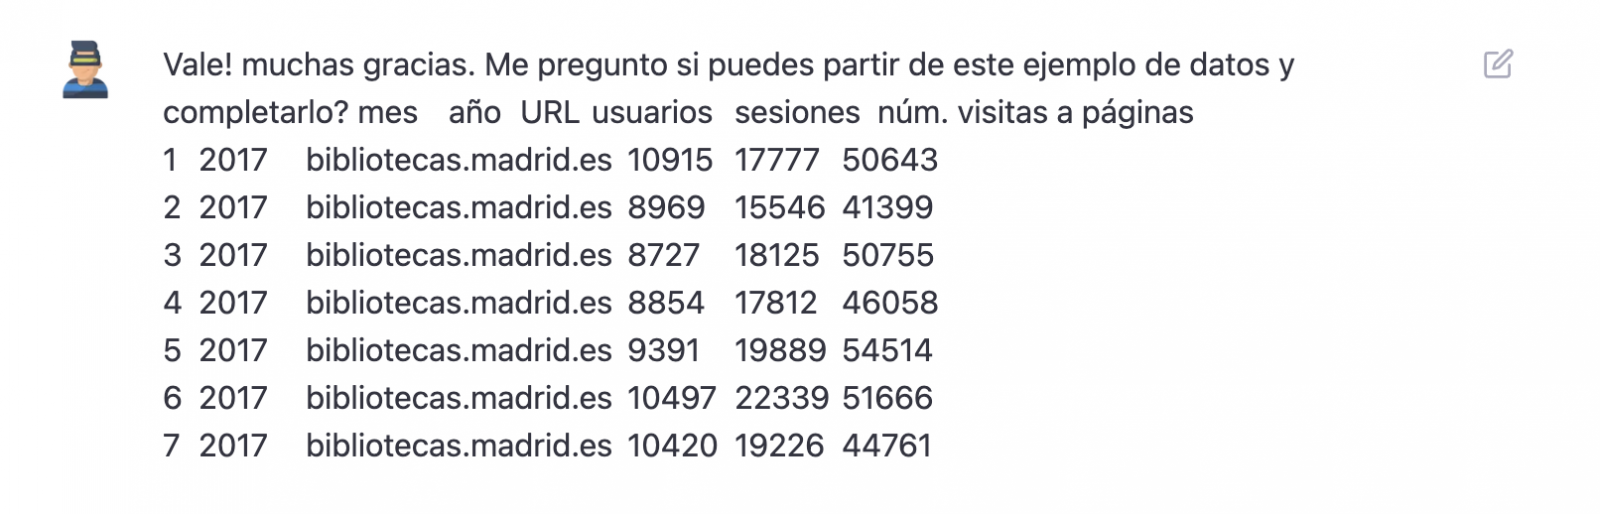

With the data copied and pasted as we have given it to it, the AI writes the code in R to load it manually into a dataframe called \"data\". It then gives us the code for ggplot2 (the most popular graphics library in R) to plot the data along with an explanation of how the code works.

Great! This is a spectacular result with a totally natural language and not at all adapted to talk to a machine. Let's see what happens next:
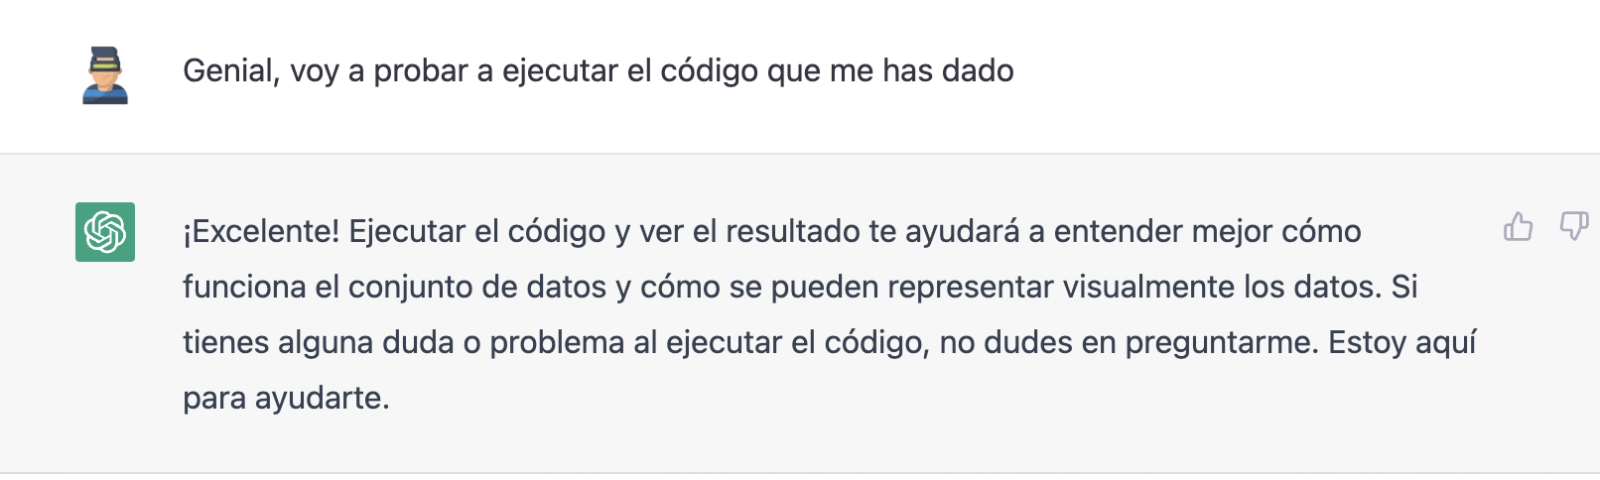
But it turns out that when we copy and paste the code into an RStudio environment it is no running.

So, we tell to it what's going on and ask it to help us to solve it.

We tried again and, in this case, it works!
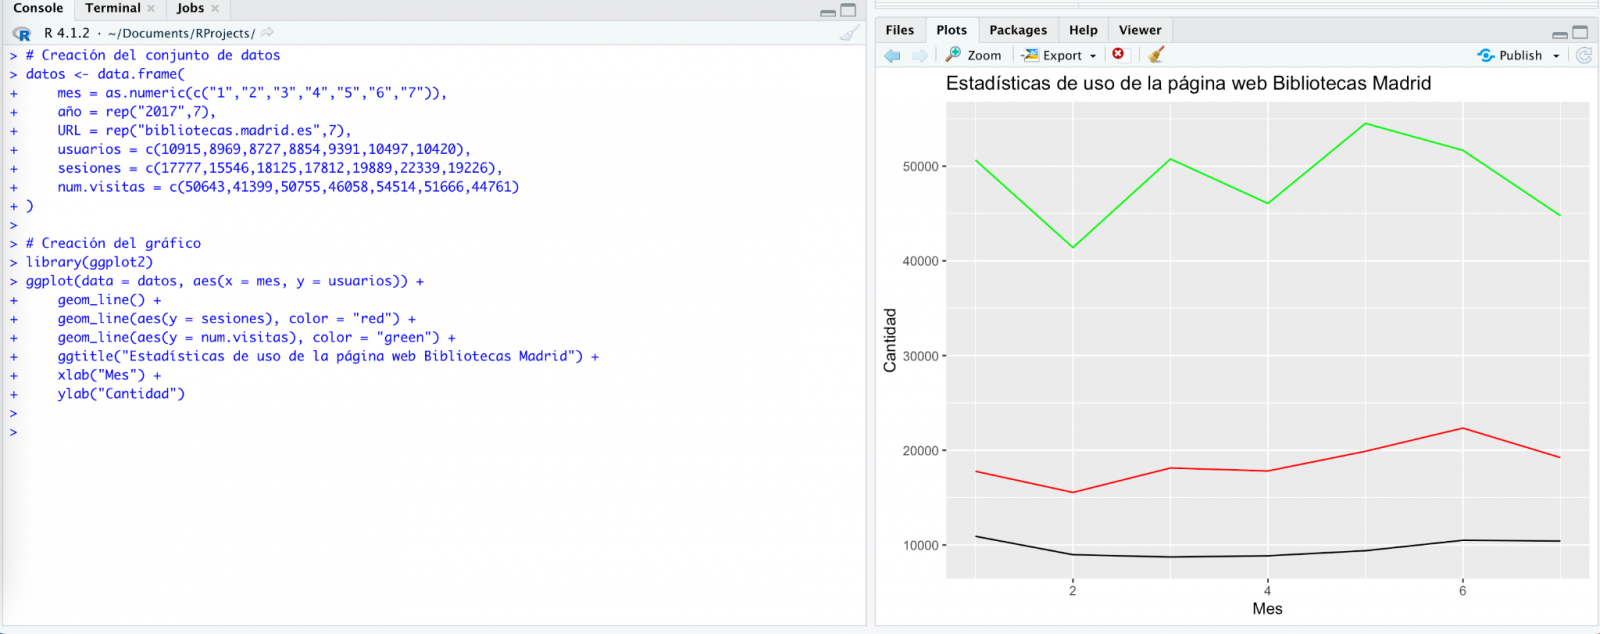
However, the result is a bit clumsy. So, we tell it.

From here (and after several attempts to copy and paste more and more rows of data) the AI changes the approach slightly and provides me with instructions and code to load my own data file from my computer instead of manually entering the data into the code.

We take its opinion into account and copy a couple of years of data into a text file on our computer. Watch what happens next:
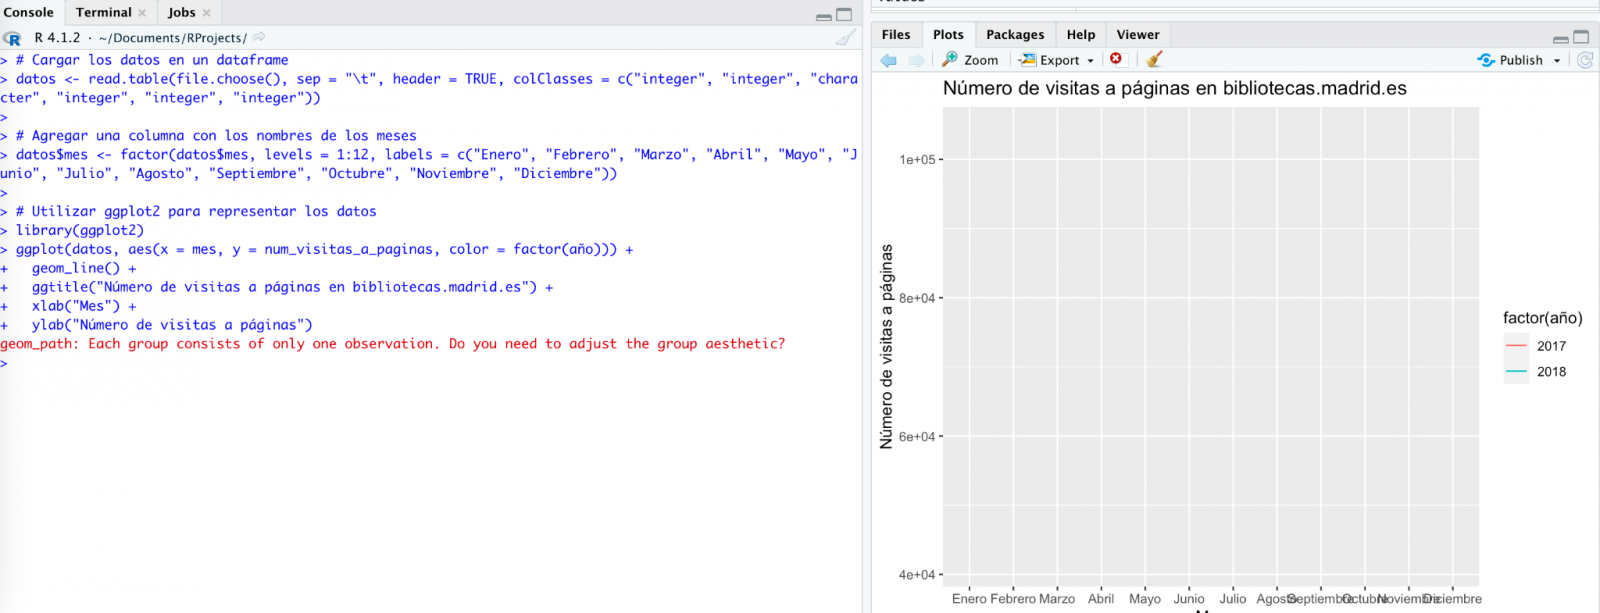

We try again:
As you can see, it works, but the result is not quite right.
And let's see what happens.

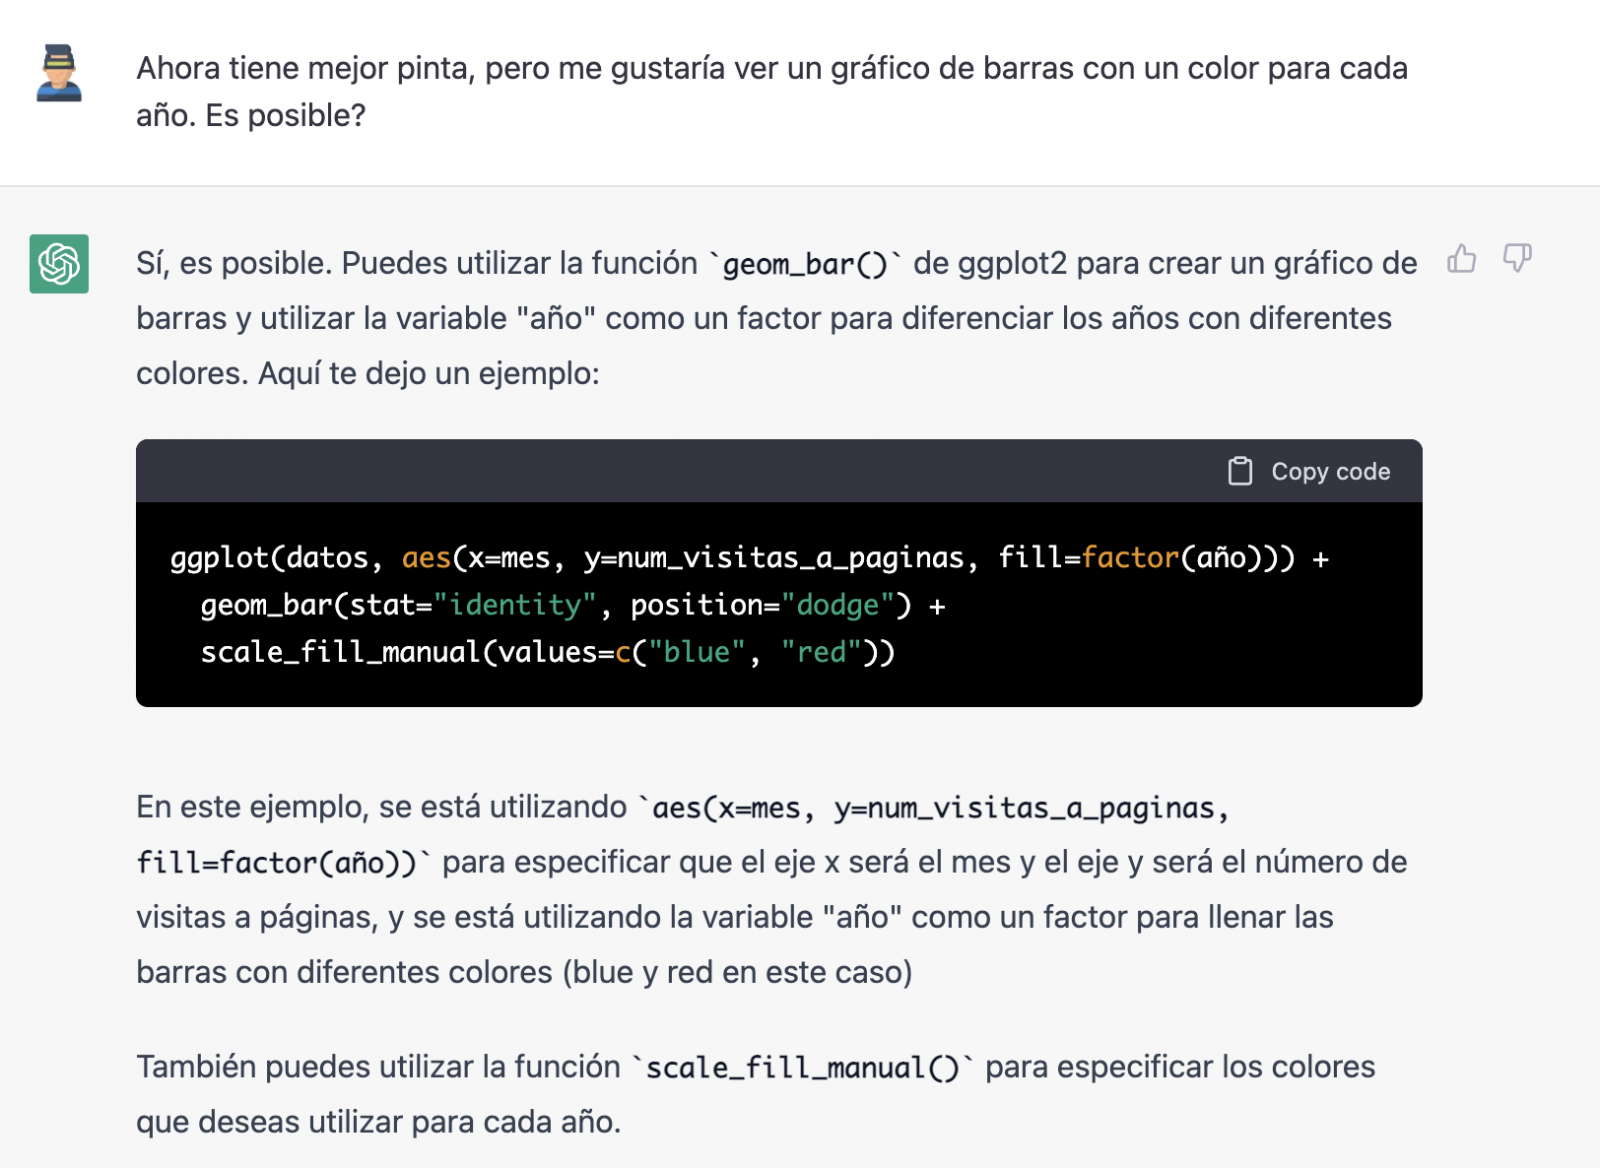
Finally, it looks like it has understood us! That is, we have a bar chart with the visits to the website per month, for the years 2017 (blue) and 2018 (red). However, I am not convinced by the format of the axis title and the numbering of the axis itself.

Let's look at the result now.

It looks much better, doesn't it? But what if we give it one more twist?
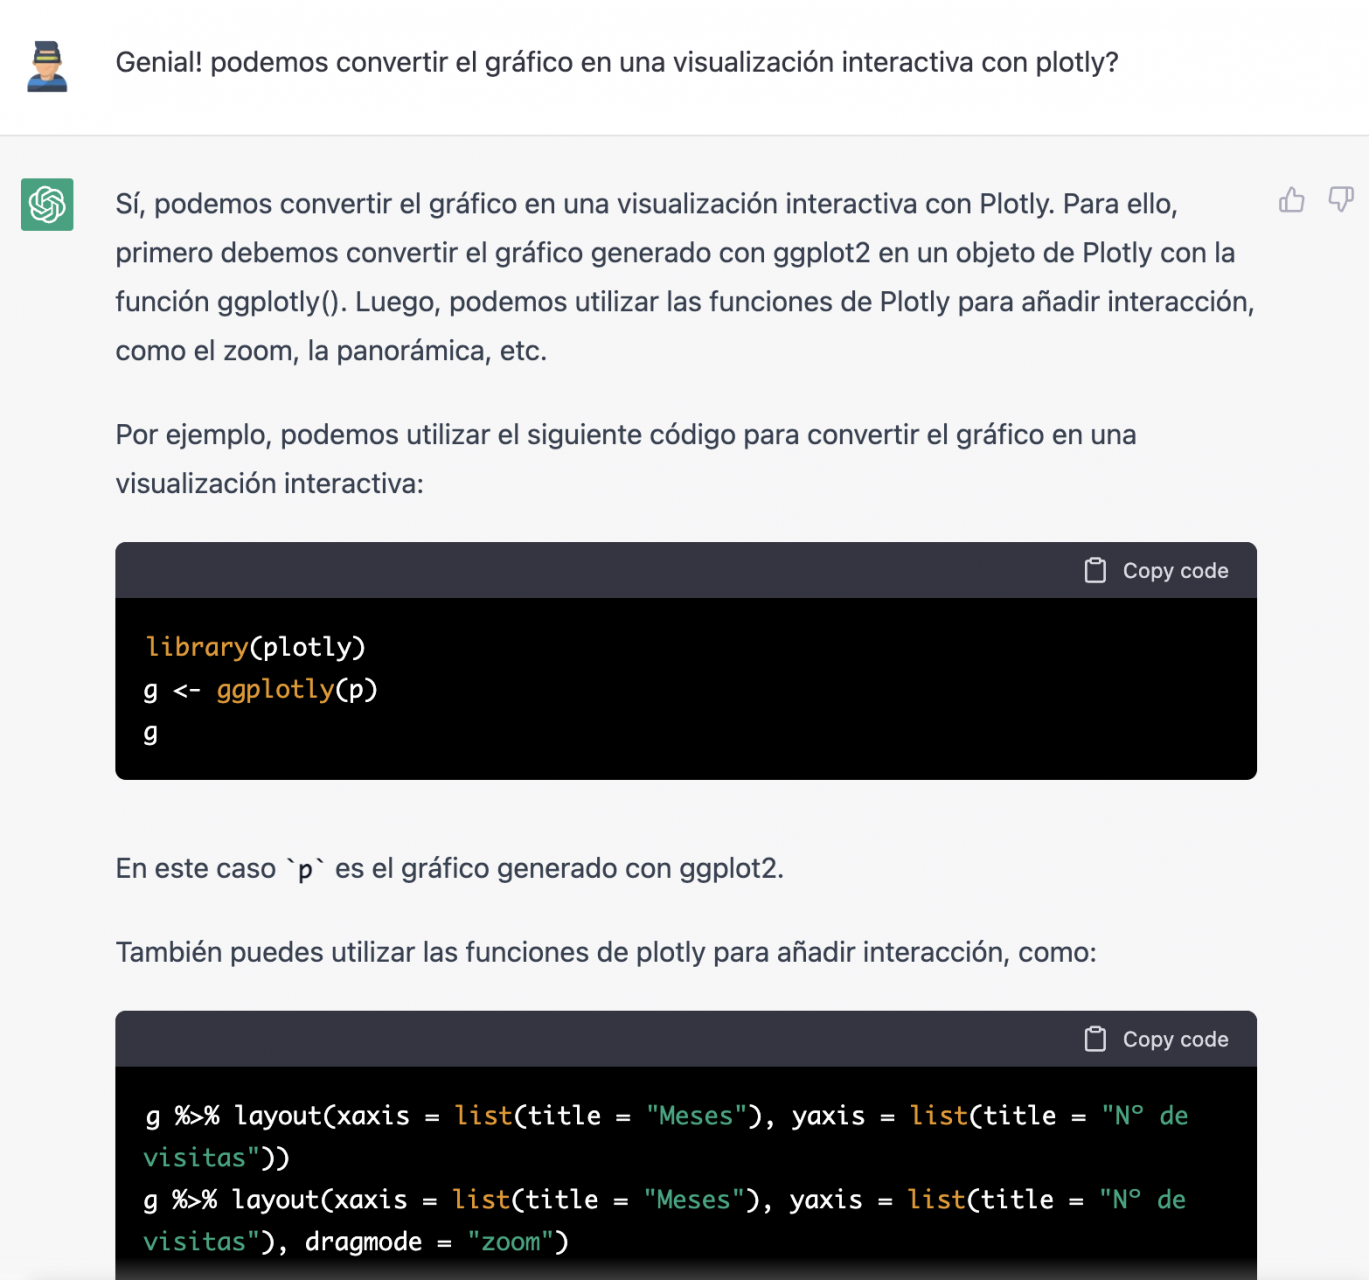
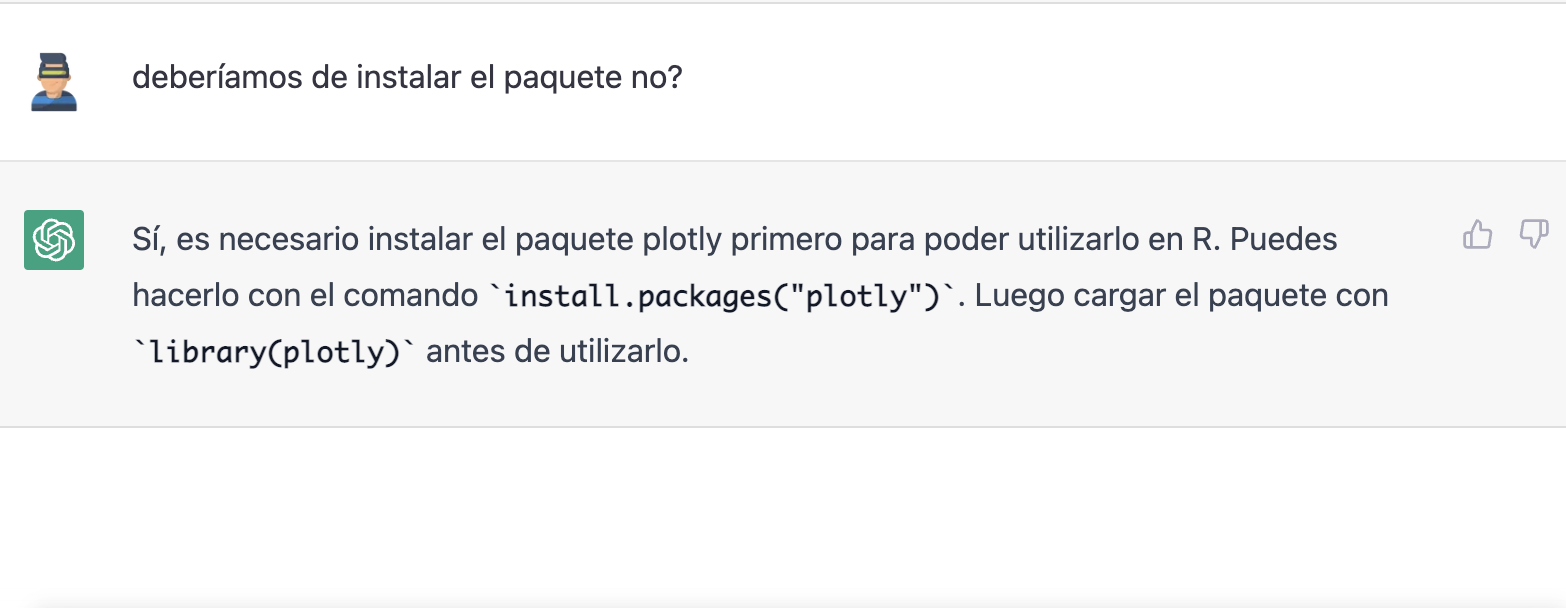
However, it forgot to tell us that we must install the plotly package or library in R. So, we remind it.
Let's have a look at the result:

As you can see, we have now the interactive chart controls, so that we can select a particular year from the legend, zoom in and out, and so on.
Conclusion
You may be one of those sceptics, conservatives or cautious people who think that the capabilities demonstrated by GPT-3 so far (ChatGPT, Dall-E2, etc) are still very infantile and impractical in real life. All considerations in this respect are legitimate and, many of them, probably well-founded.
However, some of us have spent a good part of our lives writing programs, looking for documentation and code examples that we could adapt or take inspiration from; debugging bugs, etc. For all of us (programmers, analysts, scientists, etc.) to be able to experience this level of interlocution with an artificial intelligence in beta mode, made freely available to the public and being able to demonstrate this capacity for assistance in co-programming, is undoubtedly a qualitative and quantitative leap in the discipline of programming.
We don't know what is going to happen, but we are probably on the verge of a major paradigm shift in computer science, to the point that perhaps the way we program has changed forever and we haven't even realised it yet.
Content prepared by Alejandro Alija, Digital Transformation expert.
The contents and points of view reflected in this publication are the sole responsibility of the author.
Blog
Generative artificial intelligence refers to machine’s ability to generate original and creative content, such as images, text or music, from a set of input data. As far as text generation is concerned, these models have been accessible, in an experimental format, for some time, but began to generate interest in mid-2020 when Open AI, an organisation dedicated to research in the field of artificial intelligence, published access to its GPT-3 language model via an API.
The GPT-3's architecture is composed of 175 billion parameters, comparing to its predecessor GPT-2 was 1.5 billion parameters, i.e. more than 100 times more. Therefore, GPT-3 represents a huge change in scale as it was also trained with a much larger corpus of data and a much larger token size, which allowed it to acquire a deeper and more complex understanding of the human language.
Although it was in 2022 when OpenAI announced the launch of chatGPT, which provides a conversational interface to a language model based on an improved version of GPT-3, it has only been in the last two months that the chat has attracted massive public attention, thanks to extensive media coverage that tries to respond to the emerging general interest.
In fact, ChatGPT is not only able to generate text from a set of characters (prompt) like GPT-3, but also it is able to respond to natural language questions in several languages including English, Spanish, French, German, Italian or Portuguese. This specific updated issue in the access interface from an API to a chatbot that has made the AI accessible to any type of user.
Maybe for this reason, more than a million people registered to use it in just five days, which has led to the multiplication of examples in which chatGPT produces software code, university-level essays, poems and even jokes. Not to mention the fact that it has been able to ace an history SAT or pass the final MBA exam at the prestigious Wharton School.
All of this has put generative AI at the centre of a new wave of technological innovation that promises to revolutionise the way we relate to the internet and the web through AI-powered searches or browsers capable of summarising the results of these searches.
Just a few days ago, we heard the news that Microsoft is working on the implementation of a conversational system within its own search engine, which has been developed based on the well-known Open AI language model and whose news has put Google in check.
As a result of this new reality in which AI is here to stay, the technological giants have gone a step further in the battle to make the most of the benefits it brings. Along these lines, Microsoft has presented a new strategy aimed at optimising the way in which we interact with the internet, introducing AI to improve the results offered by browser search engines, applications, social networks and, in short, the entire web ecosystem.
However, although the path in the development of new and future services offered by Open AI's remains to be seen, advances such as the mentioned above, offer a small hint of the browser war that is coming and that will probably change the way we create and find content on the web in the short term.
The open data
GPT-3, like other models that have been generated with the techniques described in the original GTP-3 scientific publication, is a pre-trained language model, which means that it has been trained with a large dataset, in total about 45 terabytes of text data. According to the paper, the training dataset was composed of 60% of data obtained directly from the internet containing millions of documents of all kinds, 22% from the WebText2 corpus built from Reddit, and the rest from a combination of books (16%) and Wikipedia (3%).
However, it is not known exactly how much open datasets GPT-3 uses, as OpenAI does not provide more specific details about the dataset used to train the model. What we can ask chatGPT itself are some questions that can help us draw interesting conclusions about its use of open data.
For example, if we ask chatGPT what was the population of Spain between 2015 and 2020 (we cannot ask for more recent data), we get an answer like this:
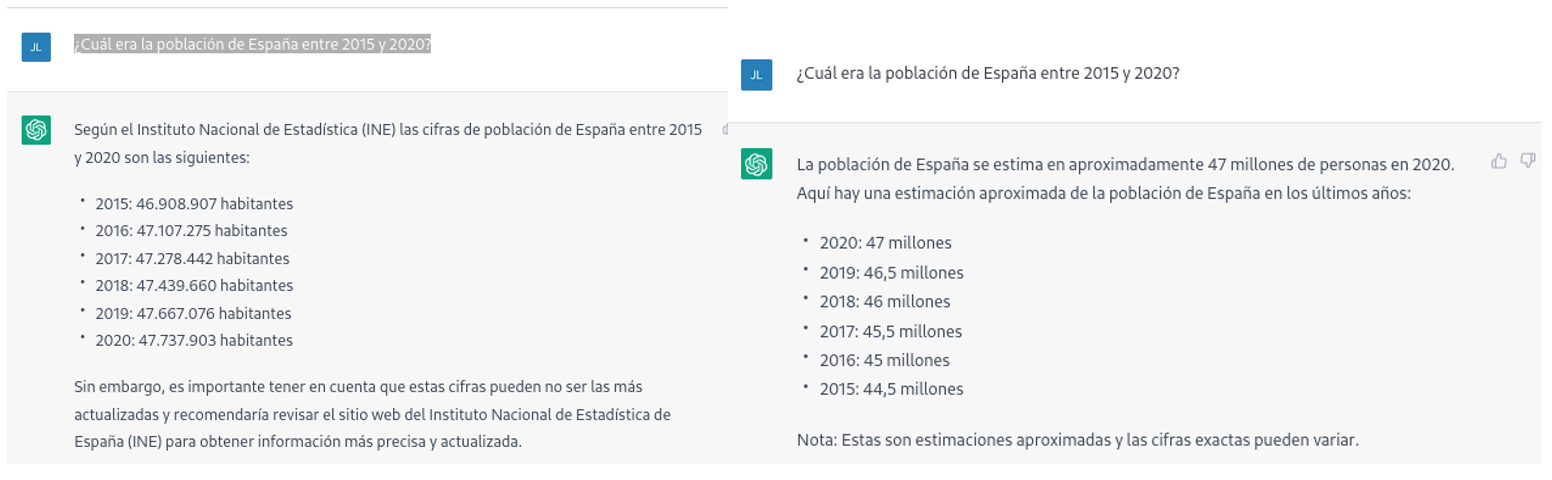
As we can see in the image above, although the question is the same, the answer may vary in both the wording and the information it contains. The variations can be even greater if we ask the question on different days or in different threads: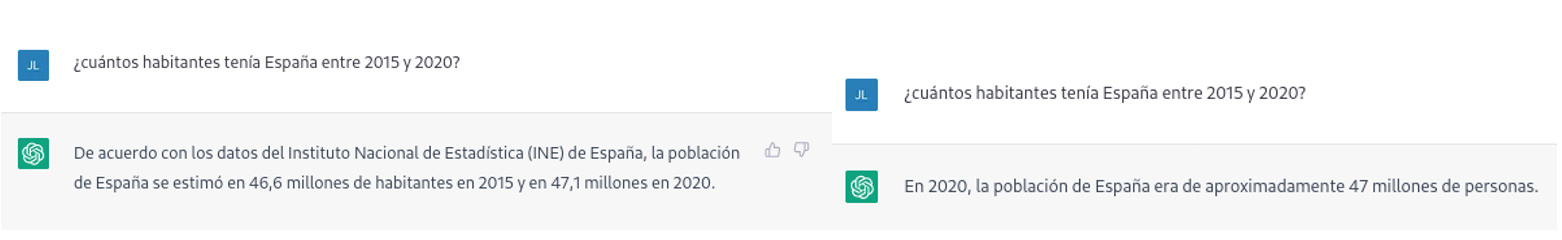
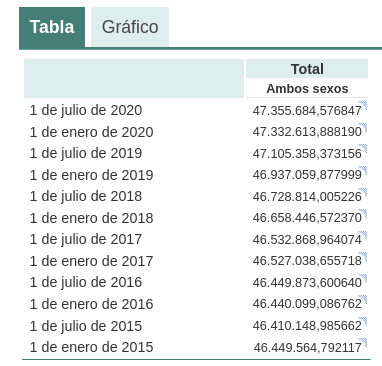
Small variations in the wording of the text, generating the question at different times in the conversation thread (remember that it saves the context) or in different threads or on different days may lead to slightly different results. Moreover, the answer is not completely accurate, as the tool itself warns us if we compare it with the INE's own series on the resident population in Spain, where it recommends us to consult. The data that we would ideally have expected in the response could be obtained in an open INE dataset:
Such responses suggest that open data has not been used as an authoritative source for answering factual questions, or at least that the model is not yet fully refined on this matter. Doing some basic tests with questions about other countries we have observed similar errors, so this does not seem to be a problem only with questions referring to Spain.
If we ask more specific questions, such as asking for a list of the municipalities in the province of Burgos that begin with the letter "G", we get answers that are not completely correct, as is typical of a technology that is still in its infancy.
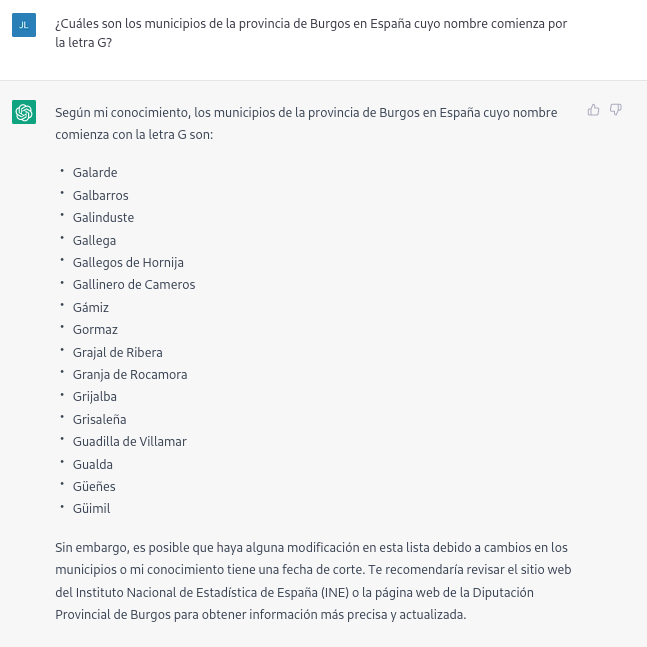
The correct answer should contain six municipalities: Galbarros, La Gallega, Grijalba, Grisaleña, Gumiel de Hizán and Gumiel del Mercado. However, the answer we have obtained only contains the first four and includes localities in the province of Guadalajara (Gualda), municipalities in the province of Valladolid (Gallegos de Hornija) or localities in the province of Burgos that are not municipalities (Galarde). In this case, we can also turn to the open dataset to get the correct answer.
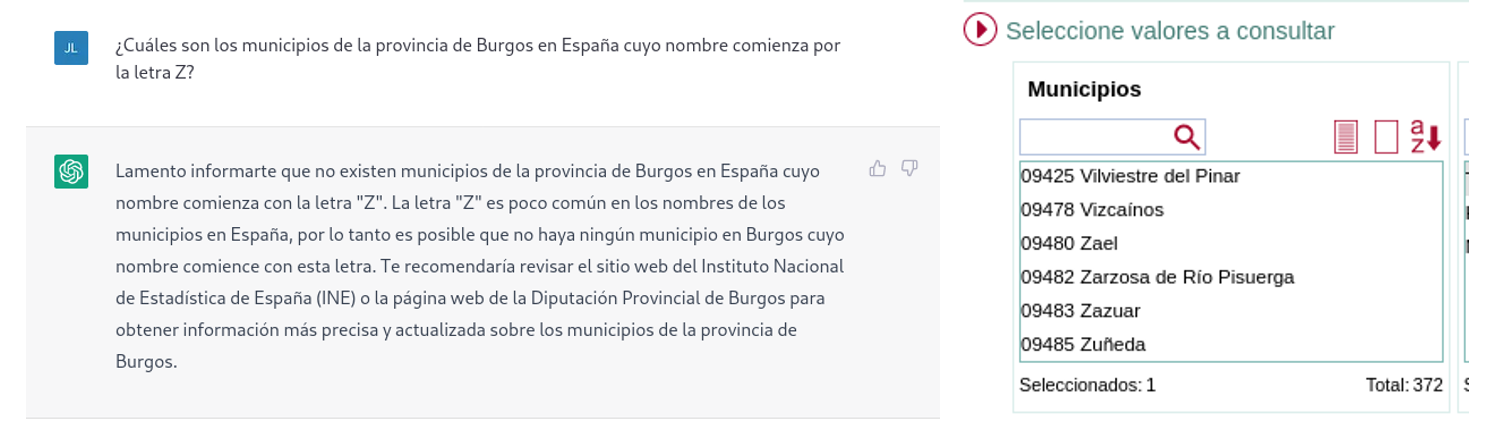
Next, we ask ChatGPT for the list of municipalities beginning with the letter Z in the same province. ChatGPT tells us that there are none, reasoning the answer, when in fact there are four:
As can be seen from the examples above, we can see how open data can indeed contribute to technological evolution and thus improve the performance of Open AI's artificial intelligence. However, given its current state of maturity, it is still too early to see the optimal use of open data to answer more complex questions.
Therefore, for a generative AI model to be effective, it is necessary to have a large amount of high quality and diverse data, and open data is a valuable source of knowledge for this purpose.
In future versions of the model, we will probably be able to see how open data will acquire a much more important role in the composition of the training corpus, achieving a significant improvement in the quality of the factual answers.
Content prepared by Jose Luis Marín, Senior Consultant in Data, Strategy, Innovation & Digitalization.
The contents and views reflected in this publication are the sole responsibility of the author.
Blog
Although it may seem like a novel concept, the term 'artificial intelligence' was already coined in the mid-twentieth century. However, its popularity has experienced a vertiginous increase in recent years thanks to the increase in data volumes or the application of advanced algorithms in everyday situations, among other aspects.
Artificial intelligence allows machines to learn from experience to perform various tasks in a human-like manner. To do so, its training techniques often rely on deep learning and natural language processing (NLP), among others. By employing these technologies in the service of AI, machines can be trained to carry out very specific tasks such as processing large amounts of data or pattern recognition in them.
What is artificial intelligence?
The European Commission defines artificial intelligence as the ability of a machine to imitate some of the characteristics of human intelligence such as learning, reasoning or creativity. To do so, computers analyze available information in order to achieve specific objectives.
Artificial intelligence is also composed of subfields based on technologies such as Machine Learning or Deep Learning. Both activities aim to build systems that have the ability to solve problems without the need for human intervention.
What is the role of open data in artificial intelligence?
To ensure the proper development of artificial intelligence, open data is extremely important. This is because its algorithms must be trained with high-quality data that is readily available, as reflected in various state and European-level strategies and guidelines such as the National Artificial Intelligence Strategy, the European Regulation on Artificial Intelligence, and the White Paper on Artificial Intelligence.
Examples of use cases of artificial intelligence
The application of artificial intelligence allows many fields to achieve improvements in various processes, services, or applications. Some examples are:
- Health: AI allows for the identification of different pathologies through the processing of medical images, for example, through QMenta, which processes and visualizes images to perform analysis of brain data.
- Environment: AI allows for more efficient forest management. An example is Forecast, which offers tools for decision-making by forest managers.
- Economy: AI is used to optimize the management of tenders, as with the Arbatro Tender tool, designed to find and choose the most suitable public tenders for each company.
- Tourism: AI allows for the development of virtual tourism assistants like Castilla y León Gurú, which features advanced NLP functions, detection of points of interest in images, and use of geolocated context.
- Culture: thanks to AI, it is possible to generate original texts and summaries of existing ones through natural language processing. MarIA has been the first Spanish-language artificial intelligence to achieve this.
- Advertising and content writing: AI systems such as Chat GPT allow for the development of texts based on specific requests.
As we can see, there are a multitude of use cases that combine artificial intelligence and open data to contribute to the progress and well-being of society. We recommend that you check out this informative infographic where we provide more details, as well as some interesting articles like this one on Dall-E so that you can expand your knowledge.
Moreover, if you want to learn more about related use cases, discover the report "Emerging Technologies and Open Data: Artificial Intelligence," which includes a practical step-by-step case study on image recognition and classification.
Click on the infographic to see it in full size and access the links:

You can view the infographic in full size by clicking here.
Blog
For years now we have been announcing that Artificial Intelligence is undergoing one of its most prolific, exciting periods. A time when applications and use cases begin to be seen in which human intelligence merges with artificial intelligence. Some occupations are changing forever. Journalists and writers now have software tools that can write for them. Content creators - images or video - can ask the machine to create for them just by saying a phrase. In this post we have taken a closer look at this last example. We have been able to test Dall-e 2 and the results have left us speechless.
Introduction
Nowadays, in the technological community worldwide, there is an underlying buzz, a collective excitement of all lovers of digital technologies and in particular of artificial intelligence. On several occasions we have mentioned the innovations of the company Open AI in this communication space. We have written several articles where we talk about the GPT-3 algorithm and what it is capable of in the field of natural language processing. Recently, OpenAI has been doing away with the waiting lists (on which many of us had been enrolled for a long time) to allow us to test in a limited way the capabilities of the GPT-3 algorithm implemented in different types of applications.
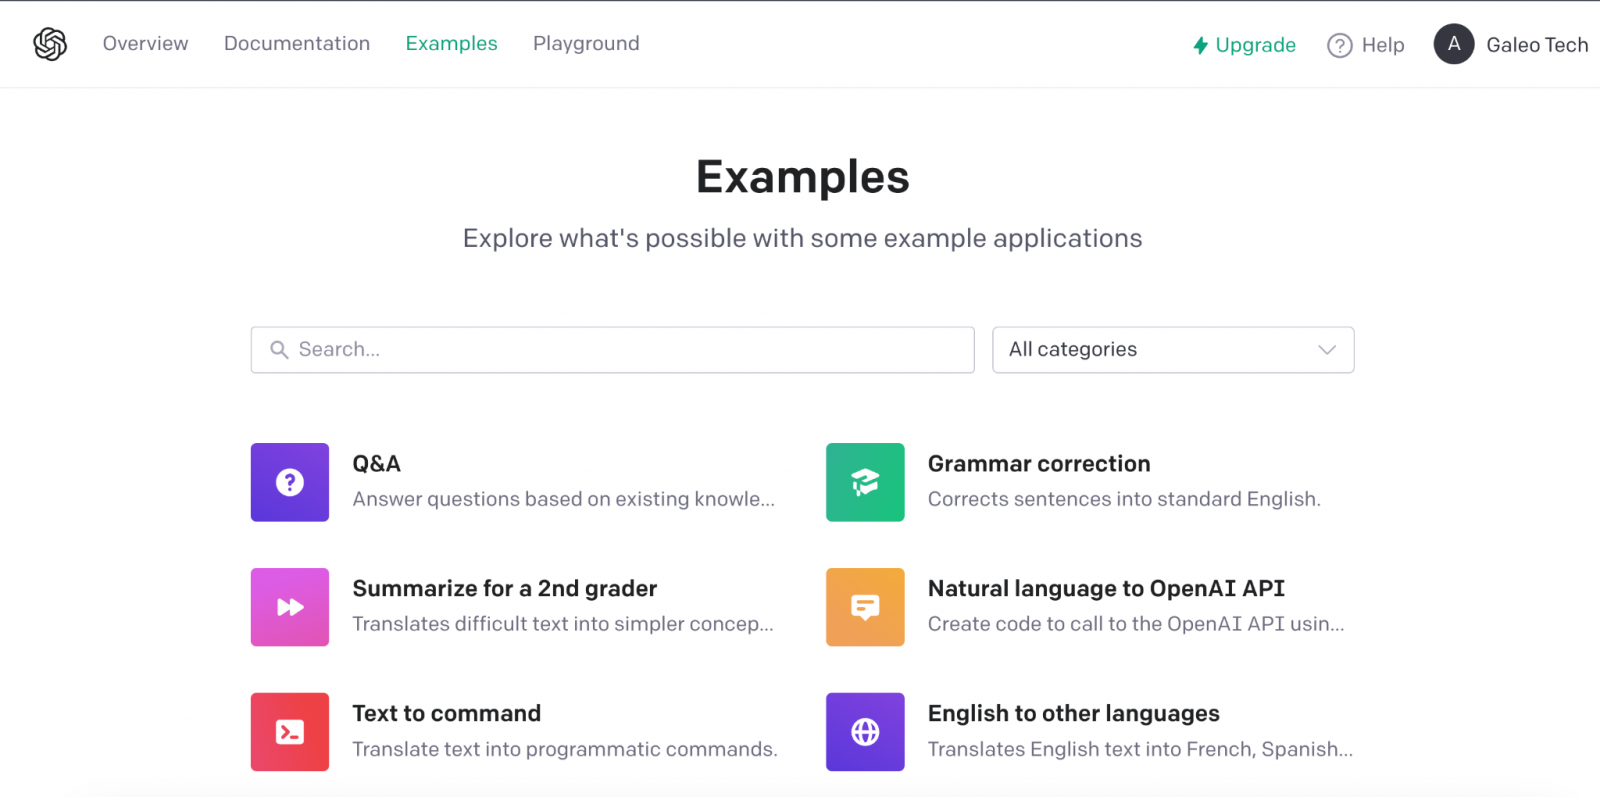
Example of the multiple applications of GPT-3 in the field of natural language.
We recommend our readers to try out the text completion tool with which, merely by providing a short sentence, the AI completes the text with several paragraphs indistinguishable from human writing. The last few days have been hectic with crowds of people testing the ChatGPT-3 tool. The degree of naturalness with which AI can have a conversation is simply amazing. The results are having an impact on a wide variety of use cases, such as support for software developers. ChatGPT-3 has been able to programme simple code routines or algorithms just from a description in natural language of what you want to programme. However, the result is even more impressive when we realise that AI is capable of correcting its own programming errors.
DALL-E
Leaving aside the capabilities of generating natural language indistinguishable from that written by a human, now let's take a look the main theme of this post. One of the most amazing applications of the AI of OpenAI is the solution known as DALL-E. What better way to introduce DALL-E than ask ChatGPT-3 what DALL-E is.
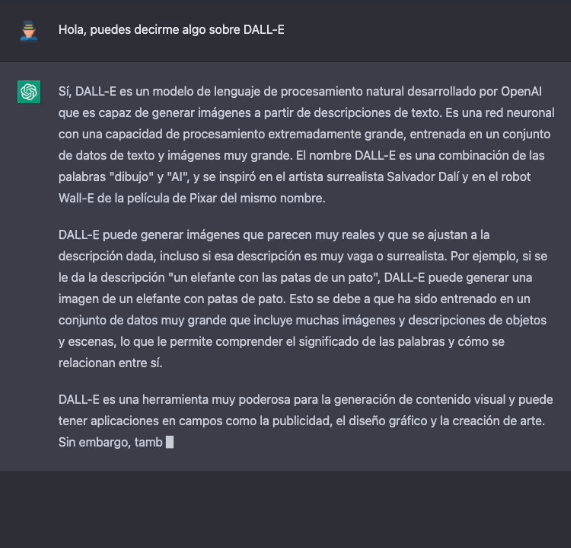
The more formal description of DALL-E, according to its own website, is as follows:
DALL·E is a 12-billion parameter version of GPT-3 trained to generate images from text descriptions. DALL-E has a diverse set of capabilities, including creating anthropomorphised versions of animals and objects, combining unrelated concepts in plausible ways, rendering text, and applying transformations to existing images..
There is currently a second version of the algorithm. DALL-E 2 capable of generating more realistic and precise images with a resolution 4 times higher. The tool for trying out DALL-E is available here https://labs.openai.com/. To use it, we first need to create an OpenAI account that will allow us to play with all the tools of the company. When we access the test website we can write our own text or ask the tool to generate random descriptions of images in natural language to create images. For example, by clicking the Surprise me button:
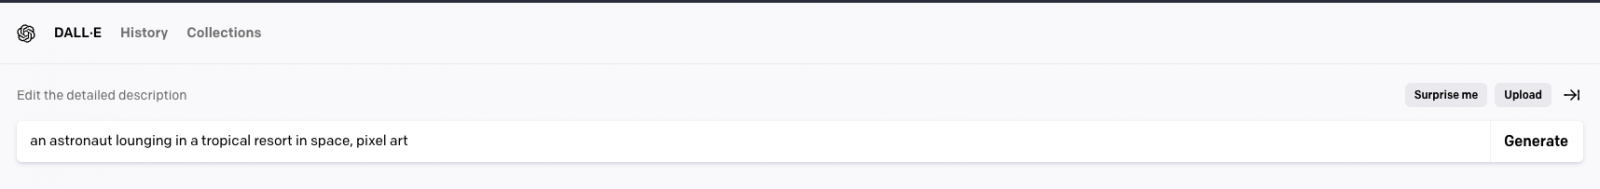
The web generates this random description for us: an astronaut lounging in a tropical resort in space, pixel art
And this is the result:

We repeat: An expressive oil painting of a basketball player dunking, depicted as an explosion of a nebula
We can assure you that the exercise is somewhat addictive and we admit that some of us have spent hours of our weekends playing with the descriptions and waiting, over and over again, for the amazing result.
About DALL-E 2 training
DALL-E 2 (arXiv:2204.06125) is a refined version of the original DALL-E system (arXiv:2102.12092). To train the original DALL-E model, which contains 12 billion parameters, a set of 250 million text-image pairs was used (publicly available online). This data set is a mixture of several prior datasets comprising: Conceptual Captions by Google; Wikipedia's text-image pairs and a filtered subset of YFCC100M.
DALL-E 2 trivia
Some interesting things besides the tests that we can do to generate our own images. OpenAI has created a specific Github repository which describes the risks and limitations of DALL-E. At the site it is reported, for example, that, for the time being, the use of DALL-E is limited to non-commercial purposes. So it is not possible to make any commercial use of the images generated. In other words, they cannot be sold or licensed under any circumstances. In this regard, all the images generated by DALL-E include a distinctive mark that lets you know that they have been generated by AI. At the Github site we can find loads of information about the generation of explicit content, the risks related with the bias that AI can introduce into the generation of images and the inappropriate uses of DALL-E such as the harassment, bullying or exploitation of individuals.

Along national lines, MarIA
Along national lines, after months of tests and adjustments, MarIA, the first supermassive artificial intelligence, has seen the light of day, trained with open data from the web archives of the National Library of Spain (BNE) and thanks to the computing resources of the National Supercomputing Centre. With regard to this post, MarIA has been trained using the GPT-2 algorithm which we have talked about many months ago in this space. To carry out the MarIA training, 135 billion previous words from the National Library's documentary bank have been used with a total volume of 570 Gigabytes of information.
Conclusions
As the days and weeks go by since the general opening of the APIs and the OpenIA tools, there has been a torrent of publications on all kinds of media, social media and specialised blogs about the capabilities and possibilities of Chat GPT-3 and DALL-E. I don't think that at this time anyone is capable of predicting the potential commercial, scientific and social applications of this technology. What is clear is that many of us think that OpenAI has shown only a sample of what it is capable of and it seems that we may be on the verge of a historic milestone in the development of AI after many years of overexpectations and unfulfilled promises. We will continue to report on the progress of GTP-3, but for the time being, all we can do is to keep enjoying, playing and learning with the simple tools that we have at our disposal!
Content prepared by Alejandro Alija, an expert in Digital Transformation.
The contents and points of view reflected in this publication are the sole responsibility of its author.
Blog
After several months competing, on 20 October the open data contest organised by the EU came to an end. The EU Datathon is a contest that gives data developers and scientists the chance to demonstrate, through their creativity, the potential of open data.
Although in this post you can find out in detail about the winning projects, in this case we would like to highlight the participation of two Spanish developers whose initiatives were chosen as semi-finalists from amongst the 156 proposals submitted at the start.
In an edition that broke the attendance records, both in terms of the number of contestants and the countries of origin, Antonio Moneo and Manuel Jose García represented Spain with two projects which stood out for their innovative nature regarding the reuse of open data.
Using Artificial Intelligence to optimally solve public tenders
Manuel José García has a PhD in Telecommunications Engineering from the University of Oviedo and currently works as a data scientist at the technology consultancy NTT Data. After scooping up first prize in the Euskadi Open Data contest in 2020, García decided to take part in the European hackathon, making the most of what he had learned from the research carried out in his PhD thesis and which gave rise to the project 'Detection of irregular tenders in Spain through big data analytics and artificial intelligence'.
"It is an initiative that uses Big Data and Artificial Intelligence (AI) to analyse the data from public tenders and to automatically recommend those companies that can best undertake the tender. With this in mind, a search engine is created for companies that can carry out a tender and a form is filled out describing the details that characterise the public tender. From that point onwards, the programme seeks the most suitable companies to carry out the project”, describes Manuel Jose García, who adds that the list of companies recommended by tender is achieved thanks to the fact that the AI model has been trained with the history of hundreds of thousands of tenders and winning companies from the past, learning what type of companies win tenders and what characteristics they have.
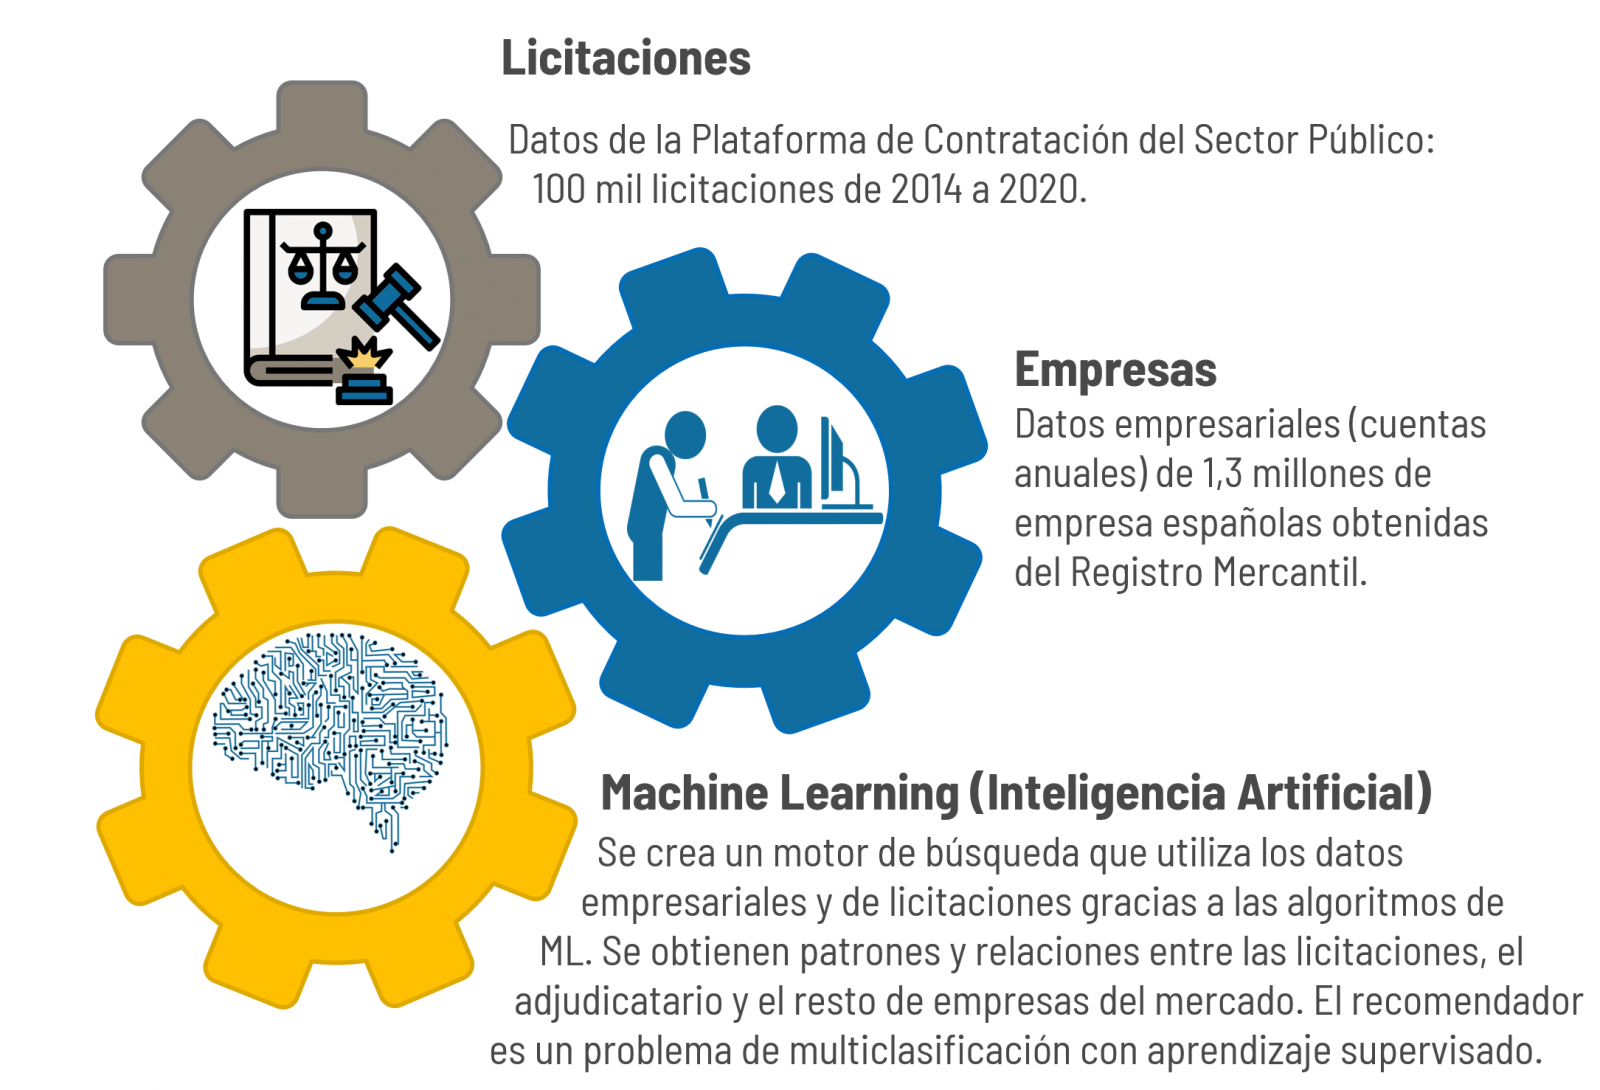
An essential requirement in order to participate in the European datathon is to use information from the data catalogues that both Europe and Spain make available to the public at a national, regional and local level. In the specific case of Manuel José García, his project has been developed using the public tender data available at the Public Procurement Platforms.
“The project has been developed using two types of data sources. On the one hand, the public and free data of the tenders and, on the other, the business data required to search for and characterise the companies present in the search engine. In particular, the annual accounts that companies must submit to the Registrar of Companies have been used. These data are public but paid and it is vogue to make them free as they are data managed by a public entity”, comments the data scientist.
In fact, it is precisely this point related with the data from the Registrar of Companies which entailed a challenge to take the project forward: “Getting structured data from public tenders is complicated, since the open data format of the Spanish Procurement Platform is difficult to handle. In addition, it is necessary to carry out thorough cleaning of the data because their quality is low”, he points out.
In his opinion, if public administrations wish to promote the reuse of open data, “They must promote the culture of data. In other words, to be aware of the importance of the data they handle and store and, in turn, be proactive to exploit said data and make them available to third parties”.
Architecture and open data to make the Sustainable Development Goals visible
In addition to being the Director of Change Management and Advanced Analysis at BBVA, Antonio Moneo was also a semi-finalist in the latest edition of the European datathon thanks to a project that merges art with the dissemination of open data.
“Tangible Data is an initiative whose goal is to convert emblematic data series into physical sculptures and thereby be able to lend visibility to issues such as climate change, inequality or the transparency of our governments. Against a backdrop of excess information and a growing digital divide, it is essential to rely on the physical environment to explain what is happening in the world", explains Antonio Moneo and he stresses that "representing data in a sculpture allows us to present a challenge from an objective, respectful perspective”.

When selecting the open data sets, Moneo was clear that he wanted to make visible the realities and statistics related with the Sustainable Development Objectives so that his project would fulfil the social purpose that led him to participate in the datathon: “We use open data from reliable sources and properly licensed with Creative Commons or MIT criteria. Sometimes we have used a private data source, but our objective is to enhance the information that is already available. In addition, we usually use the data in the manner in which they are published and only apply some transformations such as the smoothing of the curves with moving averages that allow us to make the sculptures more pleasant to the touch and, self-evidently, techniques to create volumes in three dimensions that are the basis for the sculptures," he observed.
Hence, to carry out Tangible Data it has been necessary, on the one hand, to build a physical structure and, on the other, to make it invite the user to move to the digital realm where, at the end of the day, the information they seek to make visible can be found. “The first step is to design a 3D model in virtual format which we send off to be produced locally, using the FabLabs network. Later, we include a QR code in the sculpture that allows the audience to know in depth the meaning of the data that it reflects”, explained the promoter of the project.
Developing such an ambitious project, both from a physical point of view and from an informative perspective, is no easy task. The thing is, it is not only a matter of circumventing the design of the sculpture as such, but also of finding the necessary data to transfer the reality that it is sought to represent: “Comparability is one of the biggest challenges we have encountered because, in many cases, the most relevant data for measuring the environment are not always comparable. Sometimes we find data at a regional level, sometimes at a national or local level, but it is not always possible to find all the information you need. This is why, in order to solve this challenge, we have invested more time in searching for data and, in many cases, the initial idea about a sculpture has been modified because we could not find data of sufficient quality”, he went on to say.
Moneo also commented that the other major difficulty that has marked the development of the project has been to access updated data. “Updating is always a critical issue, but right now it is even more so. The consequences of COVID, the war in Ukraine and the current energy crisis paint a very different world from the one we encountered in 2015, when the sustainable development objectives were signed. For example, it is estimated that as a consequence of the pandemic, between 70 and 150 million people will fall into the extreme poverty segment (with less than 1.9 dollars a day). This change, bucking the trend of the last three decades, is not reflected in the World Bank statistics yet as they only go up to 2019. It would this seem that that very relevant data reflect a distorted reality”, he concluded.
A positive review of his time in the EU Datathon
Despite not having reached the final that would have allowed them to compete for part of the total prize, which amounted to 200,000 euros, the two participants agreed that their experience in the datathon has been more than positive. So, whilst Manuel José García believes that "the European Commission must continue to commit to these initiatives so that people are aware of the value of data and the challenges that they can solve”, for his part, Antonio Moneo points out that “this type of action motivates the agencies that drive the data and those who are developing to improve the impact of data on society”.
What's more, both participants have managed to stimulate their professional curiosity thanks to this challenge, whilst simultaneously testing the potential and quality of their respective work vis-à-vis European data experts.