Blog
The alignment of artificial intelligence is a term established since the 1960s, according to which we orient the goals of intelligent systems in the exact direction of human values. The advent of generative models has brought this concept of alignment back into fashion, which becomes more urgent the more intelligence and autonomy systems show. However, no alignment is possible without a prior, consensual and precise definition of these values. The challenge today is to find enriching objectives where the application of AI has a positive and transformative effect on knowledge, social organisation and coexistence.
The right to understand
In this context, one of the main pillars of today's AI, language processing has been making valuable contributions to clear communication and, in particular, to clear language for years. Let us look at what these concepts are:
- Clear communication, as a discipline, aims to make information accessible and understandable for all people, using writing resources, but also visual, design, infographics, user experience and accessibility.
- Clear language focuses on the composition of texts, with techniques for presenting ideas directly and concisely, without stylistic excesses or omissions of key information.
Both concepts are closely linked to people's right to understand.
Before chatGPT: analytical approaches
Before the advent of generative AI and the popularisation of GPT capabilities, artificial intelligence was applied to plain language from an analytical point of view, with different classification and pattern search techniques. The main need then was for a system that could assess whether or not a text was understandable, but there was not yet the expectation that the same system could rewrite our text in a clearer way. Let's look at a couple of examples:
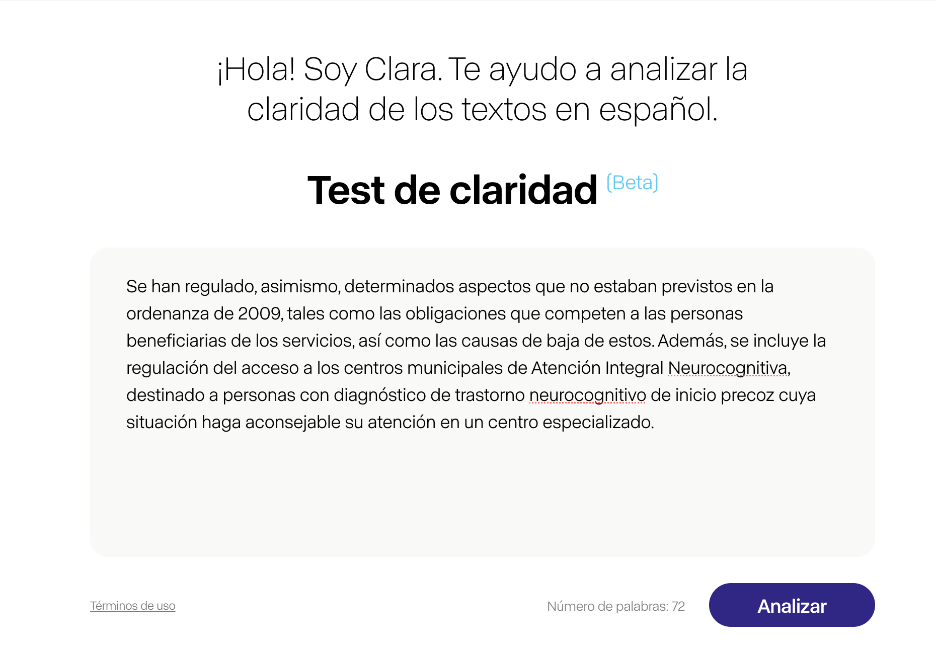
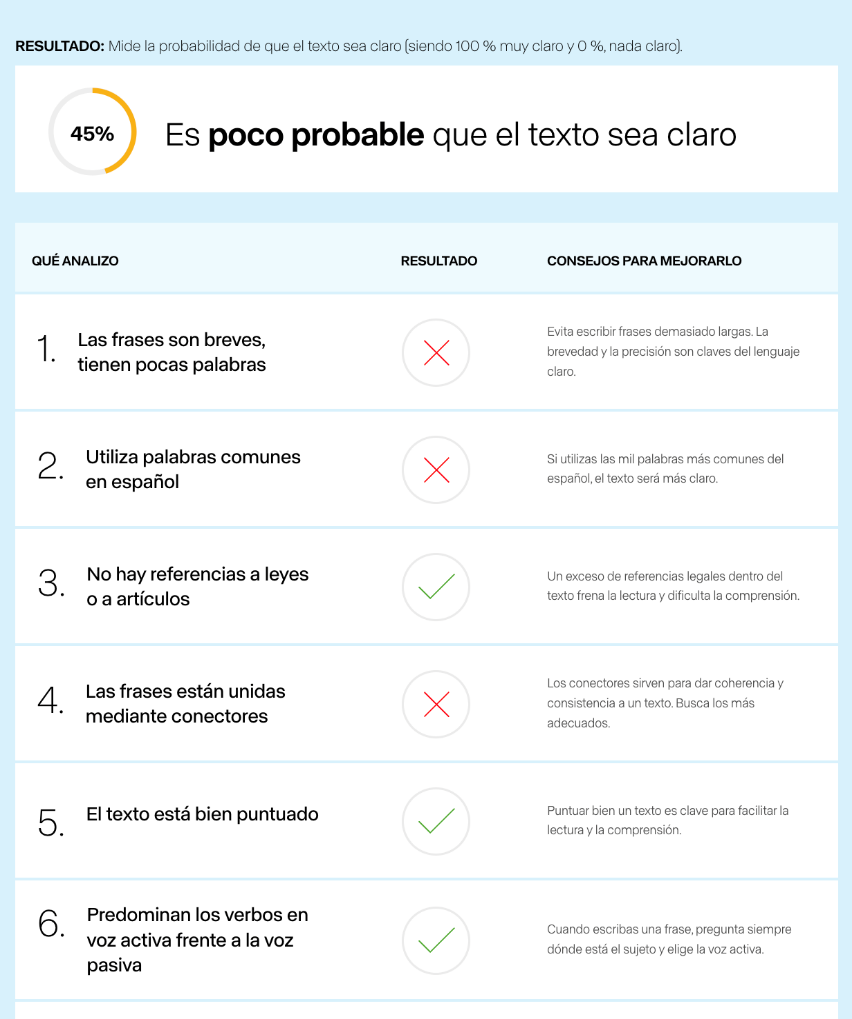
This is the case of Clara, an analytical AI system that is openly available in beta. Clara is a mixed system: on the one hand, it has learned which patterns characterise clear and unclear texts from the observation of a corpus of peers prepared by specialists in Clear Communication. On the other hand, it handles nine metrics designed by computational linguists to decide whether or not a text meets the minimum requirements for clarity, for example, the average number of words per sentence, the technicalities used or the frequency of connectors. Finally, Clara returns a percentage score to indicate whether the written text is more or less close to being clear text. This allows the user to correct the text according to Clara's indications and submit it for re-evaluation.
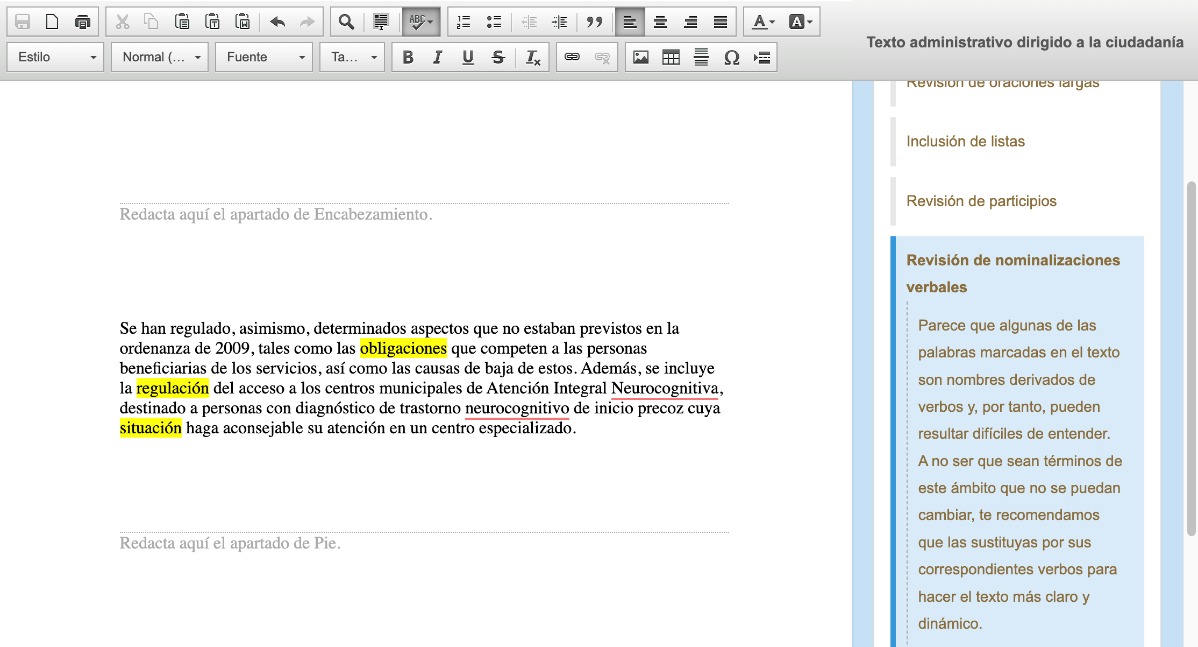
However, other analytical systems have established a different approach, such as Artext of course. Artext is more like a traditional text editor, where we can write our text and activate a series of revisions, such as participles, verb nominalisations or the use of negation. Artext highlights in colour words or expressions in our text and advises us in a side menu what we have to take into account when using them. The user can rewrite the text until, in the different revisions, the words and expressions marked in colour disappear.
Both Clara and Artext specialise in administrative and financial texts, with the aim of being of use mainly to public administration, financial institutions and other sources of difficult-to-understand texts that have an impact on citizens.
The generative revolution
Analytical AI tools are useful and very valuable if we want to evaluate a text over which we need to have more control. However, following the arrival of chatGPT in November 2022, users' expectations are set to rise even further. Not only do we need an evaluator, but we expect a translator, an automatic transformer of our text into a clearer version. We insert the original version of the text in the chat and, through a direct instruction called prompt, we ask it to transform it into a clearer and simpler text, understandable by anyone.
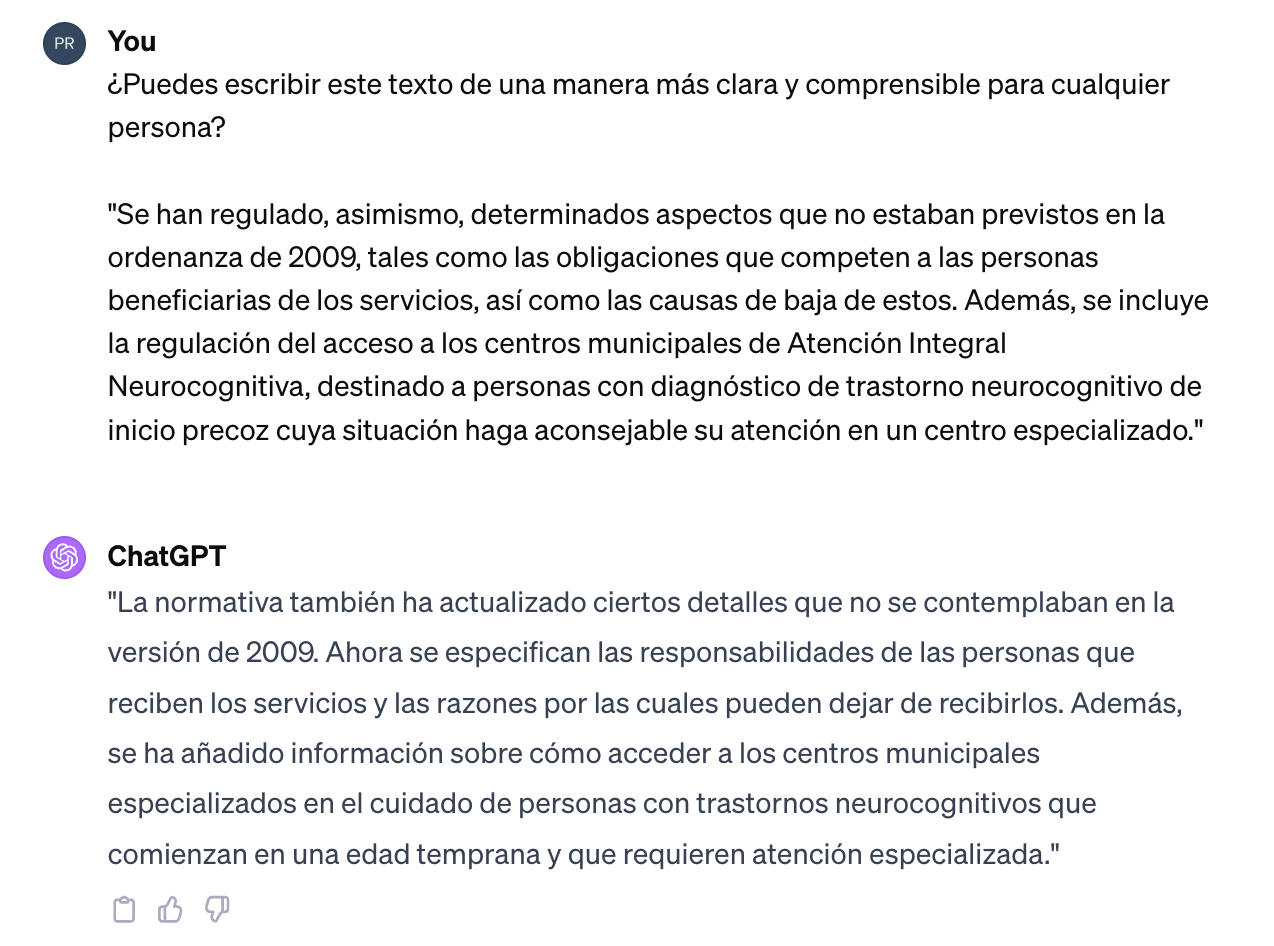
If we need more clarity, we only have to repeat the instruction and the text becomes simpler again before our eyes.
By using generative AI we are reducing cognitive effort, but we are also losing much of the control over the text. Most importantly, we will not know what modifications are being made and why, and we may incur the loss or alteration of information. If we want to increase control and keep track of the changes, deletions and additions that chatGPT makes to the text, we can use a plug-in such as EditGPT, available as an extension for Google Chrome, which allows us to keep track of changes similar to Word in our interactions with the chat. However, we would not be able to understand the rationale for the changes made, as we would with tools such as Clara or Artext designed by language professionals. One limiting option is to ask the chat to justify each of these changes, but the interaction would become cumbersome, complex and inefficient, not to mention the excessive enthusiasm with which the model would try to justify its corrections.
Examples of generative clarification
Beyond the speed of transformation, generative AI has other advantages over analytics, such as certain elements that can only be identified with GPT capabilities. For example, detecting in a text whether an acronym or acronym has been developed previously, or whether a technicality is explained immediately after its appearance. This requires very complex semantic analysis for analytical AI or rule-based models. In contrast, a great language model is able to establish an intelligent relationship between the acronym and its development, or between the technicality and its meaning, to recognise if this explanation exists somewhere in the text, and to add it where relevant.
Open data to inform clarification
Universal access to open data, especially when it is ready for computational processing, makes it indispensable for training large linguistic models. Huge sources of unstructured information such as Wikipedia, the Common Crawl project or Gutenberg allow systems to learn how the language works. And, on this generalist basis, it is possible to fit models with specialised datasets to make them more accurate in the task of clarifying text.
In the application of generative artificial intelligence to plain language we have the perfect example of a valuable purpose, useful to citizens and positive for social development. Beyond the fascination it has aroused, we have the opportunity to use its potential in a use case that favours equality and inclusiveness. The technology exists, we just need to go down the difficult road of integration.
Content prepared by Carmen Torrijos, expert in AI applied to language and communication.
The contents and points of view reflected in this publication are the sole responsibility of the author.
Blog
Teaching computers to understand how humans speak and write is a long-standing challenge in the field of artificial intelligence, known as natural language processing (NLP). However, in the last two years or so, we have seen the fall of this old stronghold with the advent of large language models (LLMs) and conversational interfaces. In this post, we will try to explain one of the key techniques that makes it possible for these systems to respond relatively accurately to the questions we ask them.
Introduction
In 2020, Patrick Lewis, a young PhD in the field of language modelling who worked at the former Facebook AI Research (now Meta AI Research) publishes a paper with Ethan Perez of New York University entitled: Retrieval-Augmented Generation for Knowledge-Intensive NLP Tasks in which they explained a technique to make current language models more precise and concrete. The article is complex for the general public, however, in their blog, several of the authors of the article explain in a more accessible way how the RAG technique works. In this post we will try to explain it as simply as possible.
Large Language Models are artificial intelligence models that are trained using Deep Learning algorithms on huge sets of human-generated information. In this way, once trained, they have learned the way we humans use the spoken and written word, so they are able to give us general and very humanly patterned answers to the questions we ask them. However, if we are looking for precise answers in a given context, LLMs alone will not provide specific answers or there is a high probability that they will hallucinate and completely make up the answer. For LLMs to hallucinate means that they generate inaccurate, meaningless or disconnected text. This effect poses potential risks and challenges for organisations using these models outside the domestic or everyday environment of personal LLM use. The prevalence of hallucination in LLMs, estimated at 15% to 20% for ChatGPT, may have profound implications for the reputation of companies and the reliability of AI systems.
What is a RAG?
Precisely, RAG techniques have been developed to improve the quality of responses in specific contexts, for example, in a particular discipline or based on private knowledge repositories such as company databases.
RAG is an extra technique within artificial intelligence frameworks, which aims to retrieve facts from an external knowledge base to ensure that language models return accurate and up-to-date information. A typical RAG system (see image) includes an LLM, a vector database (to conveniently store external data) and a series of commands or queries. In other words, in a simplified form, when we ask a natural language question to an assistant such as ChatGPT, what happens between the question and the answer is something like this:
- The user makes the query, also technically known as a prompt.
- The RAG enriches the prompt or question with data and facts obtained from an external database containing information relevant to the user's question. This stage is called retrieval
- The RAG is responsible for sending the user's prompt enriched or augmented to the LLM which is responsible for generate a natural language response taking advantage of the full power of the human language it has learned with its generic training data, but also with the specific data provided in the retrieval stage.

Understanding RAG with examples
Let us take a concrete example. Imagine you are trying to answer a question about dinosaurs. A generalist LLM can invent a perfectly plausible answer, so that a non-expert cannot distinguish it from a scientifically based answer. In contrast, using RAG, the LLM would search a database of dinosaur information and retrieve the most relevant facts to generate a complete answer.
The same was true if we searched for a particular piece of information in a private database. For example, think of a human resources manager in a company. It wants to retrieve summarised and aggregated information about one or more employees whose records are in different company databases. Consider that we may be trying to obtain information from salary scales, satisfaction surveys, employment records, etc. An LLM is very useful to generate a response with a human pattern. However, it is impossible for it to provide consistent and accurate data as it has never been trained with such information due to its private nature. In this case, RAG assists the LLM in providing specific data and context to return the appropriate response.
Similarly, an LLM complemented by RAG on medical records could be a great assistant in the clinical setting. Financial analysts would also benefit from an assistant linked to up-to-date stock market data. Virtually any use case benefits from RAG techniques to enrich LLM capabilities with context-specific data.
Additional resources to better understand RAG
As you can imagine, as soon as we look for a moment at the more technical side of understanding LLMs or RAGs, things get very complicated. In this post we have tried to explain in simple words and everyday examples how the RAG technique works to get more accurate and contextualised answers to the questions we ask to a conversational assistant such as ChatGPT, Bard or any other. However, for those of you who have the desire and strength to delve deeper into the subject, here are a number of web resources available to try to understand a little more about how LLMs combine with RAG and other techniques such as prompt engineering to deliver the best possible generative AI apps.
Introductory videos:
LLMs and RAG content articles for beginners
- DEV - LLM for dummies
- Digital Native - LLMs for Dummies
- Hopsworks.ai - Retrieval Augmented Augmented Generation (RAG) for LLMs
- Datalytyx - RAG For Dummies
Do you want to go to the next level? Some tools to try out:
- LangChain. LangChain is a development framework that facilitates the construction of applications using LLMs, such as GPT-3 and GPT-4. LangChain is for software developers and allows you to integrate and manage multiple LLMs, creating applications such as chatbots and virtual agents. Its main advantage is to simplify the interaction and orchestration of LLMs for a wide range of applications, from text analysis to virtual assistance.
- Hugging Face. Hugging Face is a platform with more than 350,000 models, 75,000 datasets and 150,000 demo applications, all open source and publicly available online where people can easily collaborate and build artificial intelligence models.
- OpenAI. OpenAI is the best known platform for LLM models and conversational interfaces. The creators of ChatGTP provide the developer community with a set of libraries to use the OpenAI API to create their own applications using the GPT-3.5 and GPT-4 models. As an example, we suggest you visit the Python library documentation to understand how, with very few lines of code, we can be using an LLM in our own application. Although OpenAI conversational interfaces, such as ChatGPT, use their own RAG system, we can also combine GPT models with our own RAG, for example, as proposed in this article.
Content elaborated by Alejandro Alija, expert in Digital Transformation and Innovation.
The contents and views expressed in this publication are the sole responsibility of the author.
Blog
We are currently in the midst of an unprecedented race to master innovations in Artificial Intelligence. Over the past year, the star of the show has been Generative Artificial Intelligence (GenAI), i.e., that which is capable of generating original and creative content such as images, text or music. But advances continue to come and go, and lately news is beginning to arrive suggesting that the utopia of Artificial General Intelligence (AGI) may not be as far away as we thought. We are talking about machines capable of understanding, learning and performing intellectual tasks with results similar to those of the human brain.
Whether this is true or simply a very optimistic prediction, a consequence of the amazing advances achieved in a very short space of time, what is certain is that Artificial Intelligence already seems capable of revolutionizing practically all facets of our society based on the ever-increasing amount of data used to train it.
And the fact is that if, as Andrew Ng argued back in 2017, artificial intelligence is the new electricity, open data would be the fuel that powers its engine, at least in a good number of applications whose main and most valuable source is public information that is accessible for reuse. In this article we will review a field in which we are likely to see great advances in the coming years thanks to the combination of artificial intelligence and open data: artistic creation.
Generative Creation Based on Open Cultural Data
The ability of artificial intelligence to generate new content could lead us to a new revolution in artistic creation, driven by access to open cultural data and a new generation of artists capable of harnessing these advances to create new forms of painting, music or literature, transcending cultural and temporal barriers.
Music
The world of music, with its diversity of styles and traditions, represents a field full of possibilities for the application of generative artificial intelligence. Open datasets in this field include recordings of folk, classical, modern and experimental music from all over the world and from all eras, digitized scores, and even information on documented music theories. From the arch-renowned MusicBrainz, the open music encyclopedia, to datasets opened by streaming industry dominators such as Spotify or projects such as Open Music Europe, these are some examples of resources that are at the basis of progress in this area. From the analysis of all this data, artificial intelligence models can identify unique patterns and styles from different cultures and eras, fusing them to create unpublished musical compositions with tools and models such as OpenAI's MuseNet or Google's Music LM.
Literature and painting
In the realm of literature, Artificial Intelligence also has the potential to make not only the creation of content on the Internet more productive, but to produce more elaborate and complex forms of storytelling. Access to digital libraries that house literary works from antiquity to the present day will make it possible to explore and experiment with literary styles, themes and storytelling archetypes from diverse cultures throughout history, in order to create new works in collaboration with human creativity itself. It will even be possible to generate literature of a more personalized nature to the tastes of more minority groups of readers. The availability of open data such as the Guttemberg Project with more than 70,000 books or the open digital catalogs of museums and institutions that have published manuscripts, newspapers and other written resources produced by mankind, are a valuable resource to feed the learning of artificial intelligence.
The resources of the Digital Public Library of America1 (DPLA) in the United States or Europeana in the European Union are just a few examples. These catalogs not only include written text, but also vast collections of visual works of art, digitized from the collections of museums and institutions, which in many cases cannot even be admired because the organizations that preserve them do not have enough space to exhibit them to the public. Artificial intelligence algorithms, by analyzing these works, discover patterns and learn about artistic techniques, styles and themes from different cultures and historical periods. This makes it possible for tools such as DALL-E2 or Midjourney to create visual works from simple text instructions with aesthetics of Renaissance painting, Impressionist painting or a mixture of both.
However, these fascinating possibilities are accompanied by a still unresolved controversy about copyright that is being debated in academic, legal and juridical circles and that poses new challenges to the definition of authorship and intellectual property. On the one hand, there is the question of the ownership of rights over creations produced by artificial intelligence. On the other hand, there is the use of datasets containing copyrighted works that have been used in the training of models without the consent of the authors. On both issues there are numerous legal disputes around the world and requests for explicit removal of content from the main training datasets.
In short, we are facing a field where the advance of artificial intelligence seems unstoppable, but we must be very aware not only of the opportunities, but also of the risks involved.
Content prepared by Jose Luis Marín, Senior Consultant in Data, Strategy, Innovation & Digitalization. The contents and points of view reflected in this publication are the sole responsibility of its author.
Blog
On September 8, the webinar \"Geospatial Trends 2023: Opportunities for data.europa.eu\" was held, organized by the Data Europa Academy and focused on emerging trends in the geospatial field. Specifically, the online conference addressed the concept of GeoAI (Geospatial Artificial Intelligence), which involves the application of artificial intelligence (AI) combined with geospatial data.
Next, we will analyze the most cutting-edge technological developments of 2023 in this field, based on the knowledge provided by the experts participating in the aforementioned webinar.
What is GeoAI?
The term GeoAI, as defined by Kyoung-Sook Kim, co-chair of the GeoAI Working Group of the Open Geospatial Consortium (OGC), refers to \"a set of methods or automated entities that use geospatial data to perceive, construct (automate), and optimize spaces in which humans, as well as everything else, can safely and efficiently carry out their geographically referenced activities.\"
GeoAI allows us to create unprecedented opportunities, such as:
- Extracting geospatial data enriched with deep learning: Automating the extraction, classification, and detection of information from data such as images, videos, point clouds, and text.
- Conducting predictive analysis with machine learning: Facilitating the creation of more accurate prediction models, pattern detection, and automation of spatial algorithms.
- Improving the quality, uniformity, and accuracy of data: Streamlining manual data generation workflows through automation to enhance efficiency and reduce costs.
- Accelerating the time to gain situational knowledge: Assisting in responding more rapidly to environmental needs and making more proactive, data-driven decisions in real-time.
- Incorporating location intelligence into decision-making: Offering new possibilities in decision-making based on data from the current state of the area that needs governance or planning.
Although this technology gained prominence in 2023, it was already discussed in the 2022 geospatial trends report, where it was indicated that integrating artificial intelligence into spatial data represents a great opportunity in the world of open data and the geospatial sector.
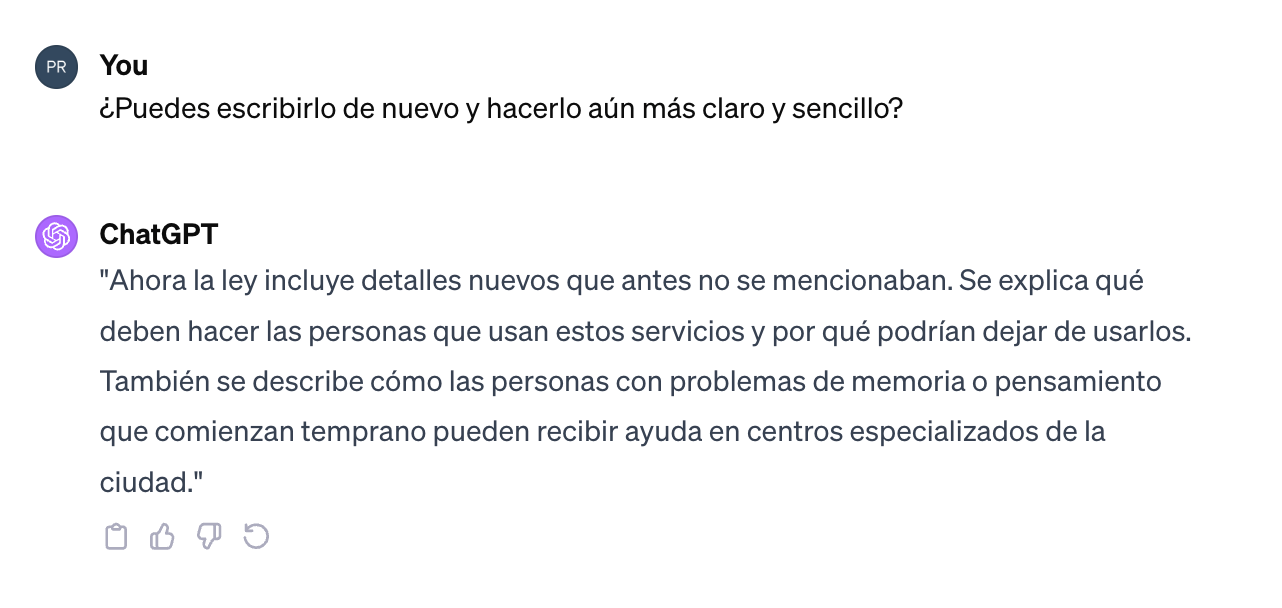
Use Cases of GeoAI
During the Geospatial Trends 2023 conference, companies in the GIS sector, Con terra and 52ºNorth, shared practical examples highlighting the use of GeoAI in various geospatial applications.
Examples presented by Con terra included:
- KINoPro: A research project using GeoAI to predict the activity of the \"black arches\" moth and its impact on German forests.
- Anomaly detection in cell towers: Using a neural network to detect causes of anomalies in towers that can affect the location in emergency calls.
- Automated analysis of construction areas: Aiming to detect building areas for industrial zones using OpenData and satellite imagery.
On the other hand, 52ºNorth presented use cases such as MariData, which seeks to reduce emissions from maritime transport by using GeoAI to calculate optimal routes, considering ship position, environmental data, and maritime traffic regulations. They also presented KI:STE, which applies artificial intelligence technologies in environmental sciences for various projects, including classifying Sentinel-2 images into (un)protected areas.
These projects highlight the importance of GeoAI in various applications, from predicting environmental events to optimizing maritime transport routes. They all emphasize that this technology is a crucial tool for addressing complex problems in the geospatial community.
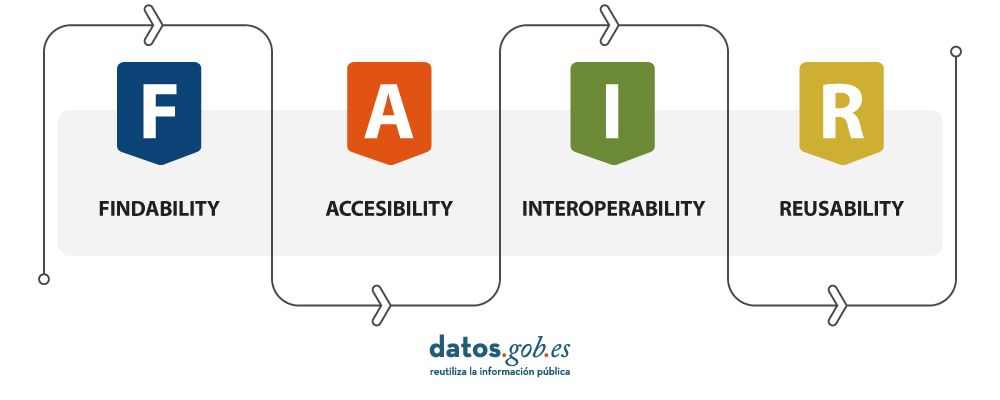
GeoAI not only represents a significant opportunity for the spatial sector but also tests the importance of having open data that adheres to FAIR principles (Findable, Accessible, Interoperable, Reusable). These principles are essential for GeoAI projects as they ensure transparent, efficient, and ethical access to information. By adhering to FAIR principles, datasets become more accessible to researchers and developers, fostering collaboration and continuous improvement of models. Additionally, transparency and the ability to reuse open data contribute to building trust in results obtained through GeoAI projects.
Reference
| Reference video | https://www.youtube.com/watch?v=YYiMQOQpk8A |
Documentación
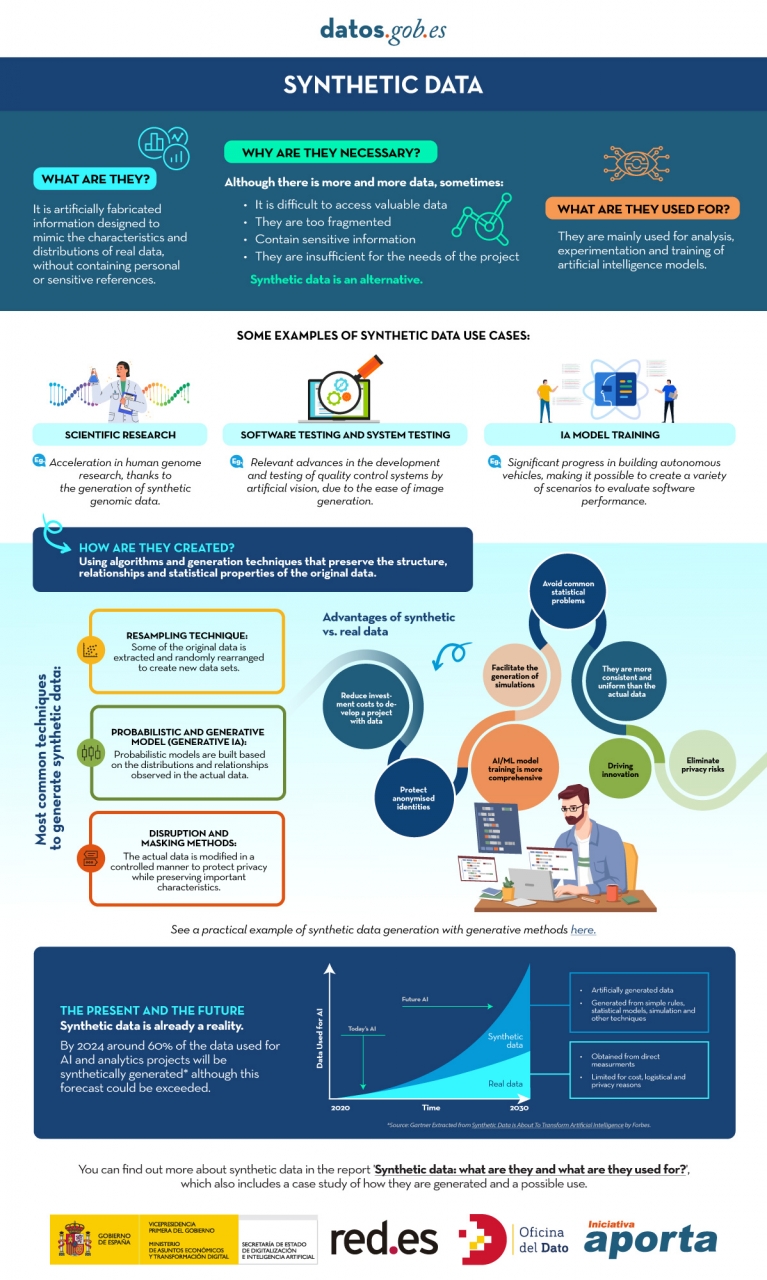
In the era of data, we face the challenge of a scarcity of valuable data for building new digital products and services. Although we live in a time when data is everywhere, we often struggle to access quality data that allows us to understand processes or systems from a data-driven perspective. The lack of availability, fragmentation, security, and privacy are just some of the reasons that hinder access to real data.
However, synthetic data has emerged as a promising solution to this problem. Synthetic data is artificially created information that mimics the characteristics and distributions of real data, without containing personal or sensitive information. This data is generated using algorithms and techniques that preserve the structure and statistical properties of the original data.
Synthetic data is useful in various situations where the availability of real data is limited or privacy needs to be protected. It has applications in scientific research, software and system testing, and training artificial intelligence models. It enables researchers to explore new approaches without accessing sensitive data, developers to test applications without exposing real data, and AI experts to train models without the need to collect all the real-world data, which is sometimes simply impossible to capture within reasonable time and cost.
There are different methods for generating synthetic data, such as resampling, probabilistic and generative modeling, and perturbation and masking methods. Each method has its advantages and challenges, but overall, synthetic data offers a secure and reliable alternative for analysis, experimentation, and AI model training.
It is important to highlight that the use of synthetic data provides a viable solution to overcome limitations in accessing real data and address privacy and security concerns. Synthetic data allows for testing, algorithm training, and application development without exposing confidential information. However, ensuring the quality and fidelity of synthetic data is crucial through rigorous evaluations and comparisons with real data.
In this report, we provide an introductory overview of the discipline of synthetic data, illustrating some valuable use cases for different types of synthetic data that can be generated. Autonomous vehicles, DNA sequencing, and quality controls in production chains are just a few of the cases detailed in this report. Furthermore, we highlight the use of the open-source software SDV (Synthetic Data Vault), developed in the academic environment of MIT, which utilizes machine learning algorithms to create tabular synthetic data that imitates the properties and distributions of real data. We present a practical example in a Google Colab environment to generate synthetic data about fictional customers hosted in a fictional hotel. We follow a workflow that involves preparing real data and metadata, training the synthesizer, and generating synthetic data based on the learned patterns. Additionally, we apply anonymization techniques to protect sensitive data and evaluate the quality of the generated synthetic data.
In summary, synthetic data is a powerful tool in the data era, as it allows us to overcome the scarcity and lack of availability of valuable data. With its ability to mimic real data without compromising privacy, synthetic data has the potential to transform the way we develop AI projects and conduct analysis. As we progress in this new era, synthetic data is likely to play an increasingly important role in generating new digital products and services.
If you want to know more about the content of this report, you can watch the interview with its author.
Below, you can download the full report, the executive summary and a presentation-summary.
Blog
Digital technology and algorithms have revolutionised the way we live, work and communicate. While promising efficiency, accuracy and convenience, these technologies can exacerbate prejudice and social inequalities exacerbate prejudice and social inequalities and create new forms of exclusion and create new forms of exclusion. Thus, invisibilisation and discrimination, which have always existed, take on new forms in the age of algorithms.
Lack of interest and data leads to algorithmic invisibilisation, leading to two types of algorithmic neglect. The first of these is among the world's underserved, which includes the millions who do not have a smartphone or a bank account millions who do not have a smartphone or a bank account, and are thus on the margins of the platform economy and who are therefore on the margins of the platform economy and, for algorithms, do not exist. The second type of algorithmic abandonment includes individuals or groups who are victims of the failure of the algorithmic system, as was the case with SyRI(Systeem Risico Indicatie)SyRI(Systeem Risico Indicatie) in the Netherlands that unfairly singled out some 20,000 families from low socio-economic backgrounds for tax fraud, leading many to ruin by 2021. The algorithm, which the algorithm, which was declared illegal by a court in The Hague months later, was applied in the country's poorest neighbourhoodsthe algorithm, which was declared illegal by a court in The Hague months later, was applied in the country's poorest neighbourhoods the algorithm, which was declared illegal by a court in The Hague months later, was applied in the poorest neighbourhoods of the country and blocked many families with more than one nationality from receiving the social benefits to which they were entitled because of their socio-economic status.
Beyond the example in the Dutch public system, invisibilisation and discrimination can also originate in the private sector. One example is Amazon's amazon's job posting algorithm which showed a bias against women by learning from historical data - i.e. incomplete data because it did not include a large and representative universe - leading Amazon to abandon the project. which showed a bias against women by learning from historical data - i.e. incomplete data because it did not include a large and representative universe - leading Amazon to abandon the project. Another example is Apple Card, a credit card backed by Goldman Sachs, which was also singled out when its algorithm was found to offer more favourable credit limits to men than to women.
In general, invisibility and algorithmic discrimination, in any field, can lead to unequal access to resources and exacerbate social and economic exclusion.
Making decisions based on algorithms
Data and algorithms are interconnected components in computing and information processing. Data serve as a basis, but can be unstructured, with excessive variability and incompleteness. Algorithms are instructions or procedures designed to process and structure this data and extract meaningful information, patterns or results.
The quality and relevance of the data directly impacts the effectiveness of the algorithms, as they rely on the data inputs to generate results. Hence, the principle "rubbish in, rubbish out"which summarises the idea that if poor quality, biased or inaccurate data enters a system or process, the result will also be of poor quality or inaccurate. On the other hand, well-designed well-designed algorithms can enhance the value of data by revealing hidden relationships or making by revealing hidden relationships or making predictions.
This symbiotic relationship underscores the critical role that both data and algorithms play in driving technological advances, enabling informed decision making, and This symbiotic relationship underscores the critical role that both data and algorithms play in driving technological advances, enabling informed decision making, and fostering innovation.
Algorithmic decision making refers to the process of using predefined sets of instructions or rules to analyse data and make predictions to aid decision making. Increasingly, it is being applied to decisions that have to do with social welfare social welfare and the provision of commercial services and products through platforms. This is where invisibility or algorithmic discrimination can be found.
Increasingly, welfare systems are using data and algorithms to help make decisions on issues such as who should receive what kind of care and who is at risk. These algorithms consider different factors such as income, family or household size, expenditures, risk factors, age, sex or gender, which may include biases and omissions.
That is why the That is why the Special Rapporteur on extreme poverty and human rights, Philip Alston, warned in a report to the UN General Assembly that the uncautious adoption of these can lead to dystopian social welfare dystopian social welfare. In such a dystopian welfarestate , algorithms are used to reduce budgets, reduce the number of beneficiaries, eliminate services, introduce demanding and intrusive forms of conditionality, modify behaviour, impose sanctions and "reverse the notion that the state is accountable".
Algorithmic invisibility and discrimination: Two opposing concepts
Although data and algorithms have much in common, algorithmic invisibility and discrimination are two opposing concepts. Algorithmic invisibility refers to gaps in data sets or omissions in algorithms, which result in inattentions in the application of benefits or services. In contrast, algorithmic discrimination speaks to hotspots that highlight specific communities or biased characteristics in datasets, generating unfairness.
That is, algorithmic invisibilisation occurs when individuals or groups are absent from datasets, making it impossible to address their needs. For example, integrating data on women with disabilities into social decision-making can be vital for the inclusion of women with disabilities in society. Globally, women are more vulnerable to algorithmic invisibilisation than men, as they have less access to digital technology have less access to digital technology and leave fewer digital traces.
Opaque algorithmic systems that incorporate stereotypes can increase invisibilisation and discrimination by hiding or targeting vulnerable individuals or populations. An opaque algorithmic system is one that does not allow access to its operation.
On the other hand, aggregating or disaggregating data without careful consideration of the consequences can result in omissions or errors result in omissions or errors. This illustrates the double-edged nature of accounting; that is, the ambivalence of technology that quantifies and counts, and that can serve to improve people's lives, but also to harm them.
Discrimination can arise when algorithmic decisions are based on historical data, which usually incorporate asymmetries, stereotypes and injustices, because more inequalities existed in the past. The "rubbish in, rubbish out" effect occurs if the data is skewed, as is often the case with online content. Also, biased or incomplete databases can be incentives for algorithmic discrimination. Selection biases may arise when facial recognition data, for example, is based on the features of white men, while the users are dark-skinned women, or on online content generated by a minority of agentswhich makes generalisation difficult.
As can be seen, tackling invisibility and algorithmic discrimination is a major challenge that can only be solved through awareness-raising and collaboration between institutions, campaigning organisations, businesses and research.
Content prepared by Miren Gutiérrez, PhD and researcher at the University of Deusto, expert in data activism, data justice, data literacy and gender disinformation.
The contents and views reflected in this publication are the sole responsibility of the author.
Blog
The UNESCO (United Nations Educational, Scientific and Cultural Organization) is a United Nations agency whose purpose is to contribute to peace and security in the world through education, science, culture and communication. In order to achieve its objective, this organisation usually establishes guidelines and recommendations such as the one published on 5 July 2023 entitled 'Open data for AI: what now?'
In the aftermath of the COVID-19 pandemic the UNESCO highlights a number of lessons learned:
- Policy frameworks and data governance models must be developed, supported by sufficient infrastructure, human resources and institutional capacities to address open data challenges, in order to be better prepared for pandemics and other global challenges.
- The relationship between open data and AI needs to be further specified, including what characteristics of open data are necessary to make it "AI-Ready".
- A data management, collaboration and sharing policy should be established for research, as well as for government institutions that hold or process health-related data, while ensuring data privacy through anonymisation and anonymisation data privacy should be ensured through anonymisation and anonymisation.
- Government officials who handle data that are or may become relevant to pandemics may need training to recognise the importance of such data, as well as the imperative to share them.
- As much high quality data as possible should be collected and collated. The data needs to come from a variety of credible sources, which, however, must also be ethical, i.e. it must not include data sets with biases and harmful content, and it must be collected only with consent and not in a privacy-invasive manner. In addition, pandemics are often rapidly evolving processes, so continuous updating of data is essential.
- These data characteristics are especially mandatory for improving inadequate AI diagnostic and predictive tools in the future. Efforts are needed to convert the relevant data into a machine-readable format, which implies the preservation of the collected data, i.e. cleaning and labelling.
- A wide range of pandemic-related data should be opened up, adhering to the FAIR principles.
- The target audience for pandemic-related open data includes research and academia, decision-makers in governments, the private sector for the development of relevant products, but also the public, all of whom should be informed about the available data.
- Pandemic-related open data initiatives should be institutionalised rather than ad hoc, and should therefore be put in place for future pandemic preparedness. These initiatives should also be inclusive and bring together different types of data producers and users.
- The beneficial use of pandemic-related data for AI machine learning techniques should also be regulated to prevent misuse for the development of artificial pandemics, i.e. biological weapons, with the help of AI systems.
The UNESCO builds on these lessons learned to establish Recommendations on Open Science by facilitating data sharing, improving reproducibility and transparency, promoting data interoperability and standards, supporting data preservation and long-term access.
As we increasingly recognise the role of Artificial Intelligence (AI), the availability and accessibility of data is more crucial than ever, which is why UNESCO is conducting research in the field of AI to provide knowledge and practical solutions to foster digital transformation and build inclusive knowledge societies.
Open data is the main focus of these recommendations, as it is seen as a prerequisite for planning, decision-making and informed interventions. The report therefore argues that Member States must share data and information, ensuring transparency and accountability, as well as opportunities for anyone to make use of the data.
UNESCO provides a guide that aims to raise awareness of the value of open data and specifies concrete steps that Member States can take to open their data. These are practical, but high-level steps on how to open data, based on existing guidelines. Three phases are distinguished: preparation, data opening and follow-up for re-use and sustainability, and four steps are presented for each phase.
It is important to note that several of the steps can be carried out simultaneously, i.e. not necessarily consecutively.
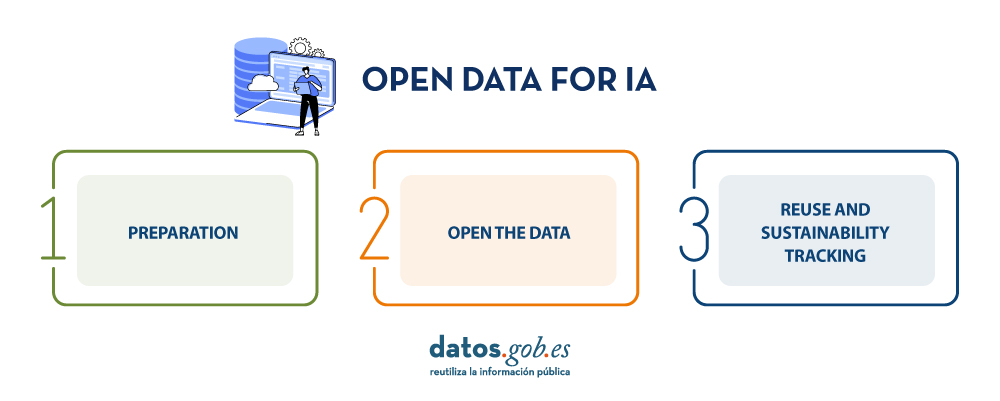
Step 1: Preparation
- Develop a data management and sharing policy: A data management and sharing policy is an important prerequisite for opening up data, as such a policy defines the governments' commitment to share data. The Open Data Institute suggests the following elements of an open data policy:
- A definition of open data, a general statement of principles, an outline of the types of data and references to any relevant legislation, policy or other guidance.
- Governments are encouraged to adhere to the principle "as open as possible, as closed as necessary". If data cannot be opened for legal, privacy or other reasons, e.g. personal or sensitive data, this should be clearly explained.
In addition, governments should also encourage researchers and the private sector in their countries to develop data management and sharing policies that adhere to the same principles.
- Collect and collate high quality data: Existing data should be collected and stored in the same repository, e.g. from various government departments where it may have been stored in silos. Data must be accurate and not out of date. Furthermore, data should be comprehensive and should not, for example, neglect minorities or the informal economy. Data on individuals should be disaggregated where relevant, including by income, sex, age, race, ethnicity, migration status, disability and geographic location.
- Develop open data capabilities: These capacities address two groups:
- For civil servants, it includes understanding the benefits of open data by empowering and enabling the work that comes with open data.
- For potential users, it includes demonstrating the opportunities of open data, such as its re-use, and how to make informed decisions.
- Prepare data for AI: If data is not only to be used by humans, but can also feed AI systems, it must meet a few more criteria to be AI-ready.
- The first step in this regard is to prepare the data in a machine-readable format.
- Some formats are more conducive to readability by artificial intelligence systems than others.
- Data must also be cleaned and labelled, which is often time-consuming and therefore costly.
The success of an AI system depends on the quality of the training data, including its consistency and relevance. The required amount of training data is difficult to know in advance and must be controlled by performance checks. The data should cover all scenarios for which the AI system has been created.
Step 2: Open the data
- Select the datasets to be opened: The first step in opening the data is to decide which datasets are to be opened. The criteria in favour of openness are:
- If there have been previous requests to open these data
- Whether other governments have opened up this data and whether this has led to beneficial uses of the data.
Openness of data must not violate national laws, such as data privacy laws.
- Open the datasets legally: Before opening the datasets, the relevant government has to specify exactly under which conditions, if any, the data can be used. In publishing the data, governments may choose the license that best suits their objectives, such as the creative Commons and Open. To support the licence selection the European Commission makes available JLA - Compatibility Checkera tool that supports this decision
- Open the datasets technically: The most common way to open the data is to publish it in electronic format for download on a website, and APIs must be in place for the consumption of this data, either by the government itself or by a third party.
Data should be presented in a format that allows for localisation, accessibility, interoperability and re-use, thus complying with the FAIR principles.
In addition, the data could also be published in a data archive or repository, which should be, according to the UNESCO Recommendation, supported and maintained by a well-established academic institution, learned society, government agency or other non-profit organisation dedicated to the common good that allows for open access, unrestricted distribution, interoperability and long-term digital archiving and preservation.
- Create a culture driven by open data: Experience has shown that, in addition to legal and technical openness of data, at least two other things need to be achieved to achieve an open data culture:
- Government departments are often not used to sharing data and it has been necessary to create a mindset and educate them to this end.
- Furthermore, data should, if possible, become the exclusive basis for decision-making; in other words, decisions should be based on data.
- In addition, cultural changes are required on the part of all staff involved, encouraging proactive disclosure of data, which can ensure that data is available even before it is requested.
Step 3: Monitoring of re-use and sustainability
- Support citizen participation: Once the data is open, it must be discoverable by potential users. This requires the development of an advocacy strategy, which may include announcing the openness of the data in open data communities and relevant social media channels.
Another important activity is early consultation and engagement with potential users, who, in addition to being informed about open data, should be encouraged to use and re-use it and to stay involved.
- Supporting international engagement: International partnerships would further enhance the benefits of open data, for example through south-south and north-south collaboration. Particularly important are partnerships that support and build capacity for data reuse, whether using AI or not.
- Support beneficial AI participation: Open data offers many opportunities for AI systems. To realise the full potential of data, developers need to be empowered to make use of it and develop AI systems accordingly. At the same time, the abuse of open data for irresponsible and harmful AI applications must be avoided. A best practice is to keep a public record of what data AI systems have used and how they have used it.
- Maintain high quality data: A lot of data quickly becomes obsolete. Therefore, datasets need to be updated on a regular basis. The step "Maintain high quality data" turns this guideline into a loop, as it links to the step "Collect and collate high quality data".
Conclusions
These guidelines serve as a call to action by UNESCO on the ethics of artificial intelligence. Open data is a necessary prerequisite for monitoring and achieving sustainable development monitoring and achieving sustainable development.
Due to the magnitude of the tasks, governments must not only embrace open data, but also create favourable conditions for beneficial AI engagement that creates new insights from open data for evidence-based decision-making.
If UNESCO Member States follow these guidelines and open their data in a sustainable way, build capacity, as well as a culture driven by open data, we can achieve a world where data is not only more ethical, but where applications on this data are more accurate and beneficial to humanity.
References
https://www.unesco.org/en/articles/open-data-ai-what-now
Author : Ziesche, Soenke , ISBN : 978-92-3-100600-5
Content prepared by Mayte Toscano, Senior Consultant in Data Economy Technologies. The contents and points of view reflected in this publication are the sole responsibility of its author.
Evento
Sign up for SEMIC 2023 and discover the interoperable Europe in the era of artificial intelligence. According to the forecasts of the European Commission, by 2025, the global volume of data will have increased by 530%, and in this context, it is crucial to ensure data interoperability and reuse. Thus, the European Union is working on creating a digital model that promotes data sharing while ensuring people's privacy and data interoperability.
The European Data Strategy includes the launch of common and interoperable data spaces in strategic sectors. In this context, various initiatives have emerged to discuss the processes, standards, and tools suitable for data management and exchange, which also serve to promote a culture of information and reuse. One of these initiatives is SEMIC, the most important interoperability conference in Europe, whose 2023 edition will take place on October 18th in Madrid, organized by the European Commission in collaboration with the Spanish Presidency of the Council of the European Union.
SEMIC 2023, which can also be attended virtually, focuses on 'Interoperable Europe in the AI era.' The sessions will address data spaces, digital governance, data quality assurance, generative artificial intelligence, and code as law, among other aspects. Information about the proposal for an Interoperable Europe Law will also be presented.
Pre-Workshops
Attendees will have the opportunity to learn about specific use cases where public sector interoperability and artificial intelligence have mutually benefited. Although SEMIC 2023 will take place on October 18th, the day before, three interesting workshops will also be held, which can be attended both in-person and virtually:
- Artificial Intelligence in Policy Design for the Digital Age and in Legal Text Writing: This workshop will explore how AI-driven tools can assist policymakers in public policy formulation. Different tools, such as the Policy Analysis Prototype (SeTA) or intelligent functionalities for legal drafting (LEOS), will be discussed.
- Large Language Models in Support of Interoperability: This session will explore the methods and approaches proposed for using large language models and AI technology in the context of semantic interoperability. It will focus on the state of LLM and its application to semantic clustering, data discovery, and terminology expansion, among other applications supporting semantic interoperability.
- European Register of Public Sector Semantic Models: This workshop will define actions to create an entry point for connecting national collections of semantic assets.
Interactions Between Artificial Intelligence, Interoperability, and Semantics
The main SEMIC 2023 conference program includes roundtable discussions and various working sessions that will run in parallel. The first session will address Estonia's experience as one of the first European countries to implement AI in the public sector and its pioneering role in interoperability.
In the morning, an interesting roundtable will be held on the potential of artificial intelligence to support interoperability. Speakers from different EU Member States will present success stories and challenges related to deploying AI in the public sector.
In the second half of the morning, three parallel sessions will take place:
- Crafting Policies for the Digital Age and Code as Law: This session will identify the main challenges and opportunities in the field of AI and interoperability, focusing on 'code as law' as a paradigm. Special attention will be given to semantic annotation in legislation.
- Interconnecting Data Spaces: This session will address the main challenges and opportunities in the development of data spaces, with a special focus on interoperability solutions. It will also discuss synergies between the Data Spaces Support Center (DSSC) and the European Commission's DIGIT specifications and tools.
- Automated Public Services: This session will provide an approach to automating access to public services with the help of AI and chatbots.
In the afternoon, three more parallel sessions will be held:
- Knowledge Graphs, Semantics, and AI: This session will demonstrate how traditional semantics benefit from AI.
- Data Quality in Generative and General-Purpose AI: This session will review the main data quality issues in the EU and discuss strategies to overcome them.
- Trustworthy AI for Public Sector Interoperability: This session will discuss the opportunities for using AI for interoperability in the public sector and the transparency and reliability challenges of AI systems.
In the afternoon, there will also be a roundtable discussion on the upcoming challenges, addressing the technological, social, and political implications of advances in AI and interoperability from the perspective of policy actions. Following this panel, the closing sessions will take place.
The previous edition, held in Brussels, brought together over 1,000 professionals from 60 countries, both in-person and virtually. Therefore, SEMIC 2023 presents an excellent opportunity to learn about the latest trends in interoperability in the era of artificial intelligence.
You can register here: https://semic2023.eu/registration/
Blog
Image segmentation is a method that divides a digital image into subgroups (segments) to reduce its complexity, thus facilitating its processing or analysis. The purpose of segmentation is to assign labels to pixels to identify objects, people, or other elements in the image.
Image segmentation is crucial for artificial vision technologies and algorithms, but it is also used in many applications today, such as medical image analysis, autonomous vehicle vision, face recognition and detection, and satellite image analysis, among others.
Segmenting an image is a slow and costly process. Therefore, instead of processing the entire image, a common practice is image segmentation using the mean-shift approach. This procedure employs a sliding window that progressively traverses the image, calculating the average pixel values within that region.
This calculation is done to determine which pixels should be incorporated into each of the delineated segments. As the window advances along the image, it iteratively recalibrates the calculation to ensure the suitability of each resulting segment.
When segmenting an image, the factors or characteristics primarily considered are:
-
Color: Graphic designers have the option to use a green-toned screen to ensure chromatic uniformity in the background of the image. This practice enables the automation of background detection and replacement during the post-processing stage.
-
Edges: Edge-based segmentation is a technique that identifies the edges of various objects in a given image. These edges are identified based on variations in contrast, texture, color, and saturation.
-
Contrast: The image is processed to distinguish between a dark figure and a light background based on high-contrast values.
These factors are applied in different segmentation techniques:
-
Thresholds: Divide the pixels based on their intensity relative to a specified threshold value. This method is most suitable for segmenting objects with higher intensity than other objects or backgrounds.
-
Regions: Divide an image into regions with similar characteristics by grouping pixels with similar features.
-
Clusters: Clustering algorithms are unsupervised classification algorithms that help identify hidden information in the images. The algorithm divides the images into groups of pixels with similar characteristics, separating elements into groups and grouping similar elements in these groups.
-
Watersheds: This process transforms grayscale images, treating them as topographic maps, where the brightness of pixels determines their height. This technique is used to detect lines forming ridges and watersheds, marking the areas between watershed boundaries.
Machine learning and deep learning have improved these techniques, such as cluster segmentation, and have also generated new segmentation approaches that use model training to enhance program capabilities in identifying important features. Deep neural network technology is especially effective for image segmentation tasks.
Currently, there are different types of image segmentation, with the main ones being:
- Semantic Segmentation: Semantic image segmentation is a process that creates regions within an image and assigns semantic meaning to each of them. These objects, also known as semantic classes, such as cars, buses, people, trees, etc., have been previously defined through model training, where these objects are classified and labeled. The result is an image where pixels are classified into each located object or class.
- Instance Segmentation: Instance segmentation combines the semantic segmentation method (interpreting the objects in an image) with object detection (locating them within the image). As a result of this segmentation, objects are located, and each of them is individualized through a bounding box and a binary mask, determining which pixels within that window belong to the located object.
- Panoptic Segmentation: This is the most recent type of segmentation. It combines semantic segmentation and instance segmentation. This method can determine the identity of each object because it locates and distinguishes different objects or instances and assigns two labels to each pixel in the image: a semantic label and an instance ID. This way, each object is unique.
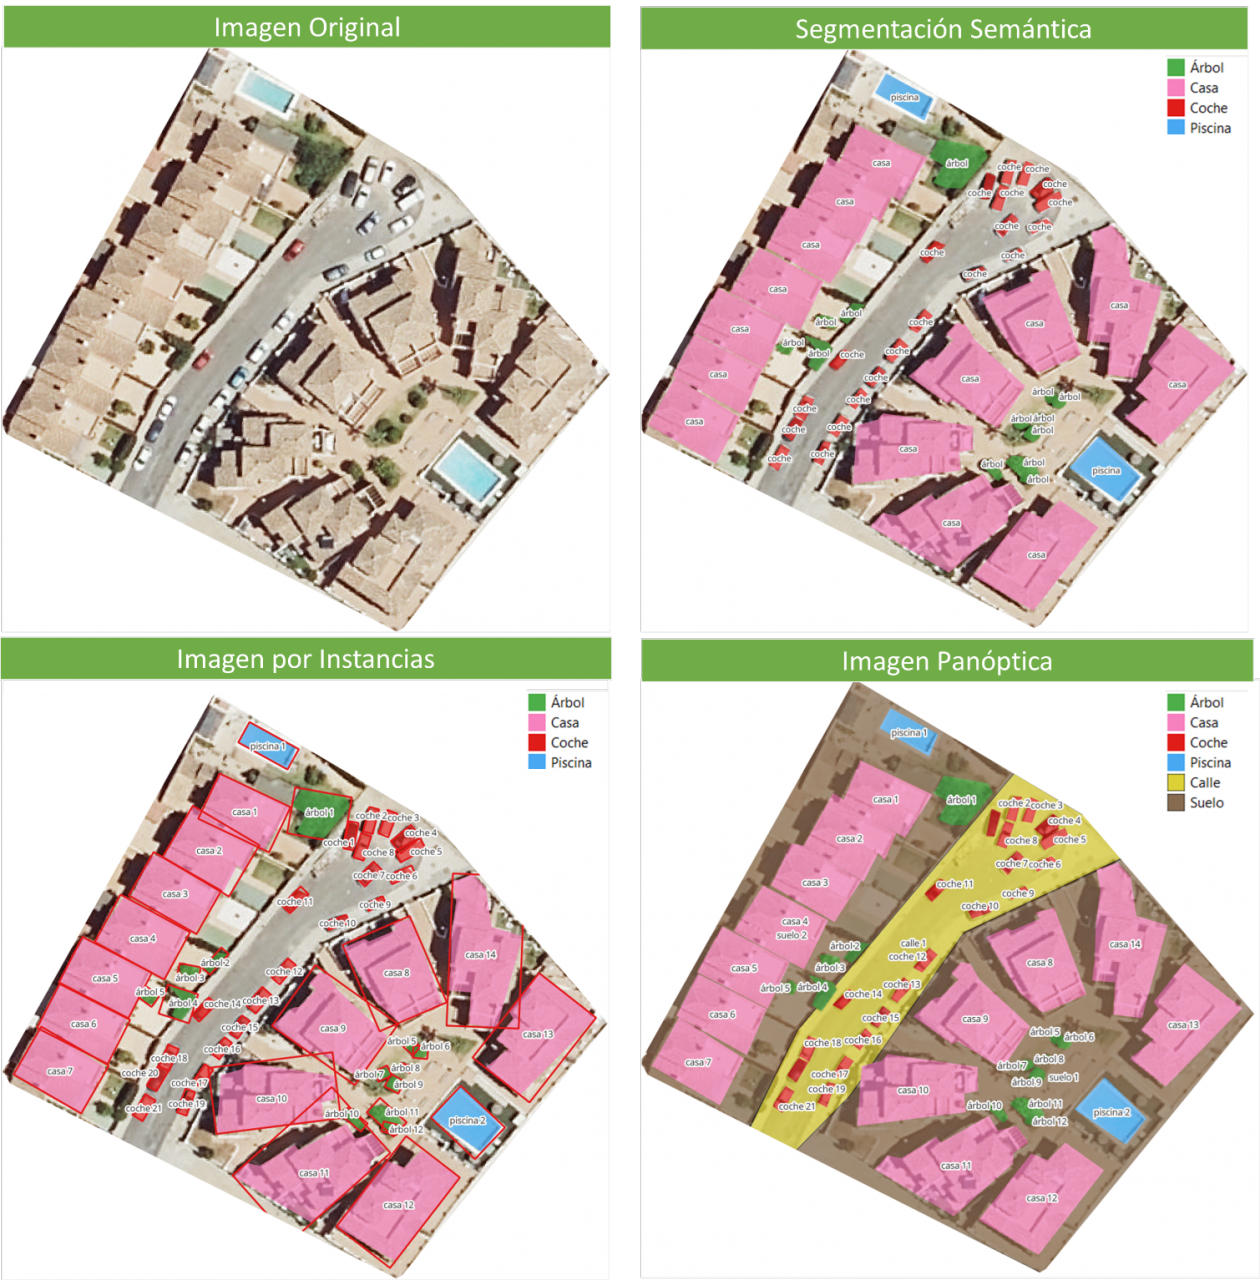
In the image, you can observe the results of applying different segmentations to a satellite image. Semantic segmentation returns a category for each type of identified object. Instance segmentation provides individualized objects along with their bounding boxes, and in panoptic segmentation, we obtain individualized objects and also differentiate the context, allowing for the detection of the ground and street regions.
Meta's New Model: SAM
In April 2023, Meta's research department introduced a new Artificial Intelligence (AI) model called SAM (Segment Anything Model). With SAM, image segmentation can be performed in three ways:
-
By selecting a point in the image, SAM will search for and distinguish the object intersecting with that point and find all identical objects in the image.
-
Using a bounding box, a rectangle is drawn on the image, and all objects found in that area are identified.
-
By using keywords, users can type a word in a console, and SAM can identify objects that match that word or explicit command in both images and videos, even if that information was not included in its training.
SAM is a flexible model that was trained on the largest dataset to date, called SA-1B, which includes 11 million images and 1.1 billion segmentation masks. Thanks to this data, SAM can detect various objects without the need for additional training.
Currently, SAM and the SA-1B dataset are available for non-commercial use and research purposes only. Users who upload their images are required to commit to using it solely for academic purposes. To try it out, you can visit this GitHub link.
In August 2023, the Image and Video Analysis Group of the Chinese Academy of Sciences released an update to their model called FastSAM, significantly reducing processing time with a 50 times faster execution speed compared to the original SAM model. This makes the model more practical for real-world usage. FastSAM achieved this acceleration by training on only 2% of the data used to train SAM, resulting in lower computational requirements while maintaining high accuracy.
SAMGEO: The Version for Analyzing Geospatial Data
The segment-geospatial package developed by Qiusheng Wu aims to facilitate the use of the Segment Anything Model (SAM) for geospatial data. For this purpose, two Python packages, segment-anything-py and segment-geospatial, have been developed, and they are available on PyPI and conda-forge.
The goal is to simplify the process of leveraging SAM for geospatial data analysis, allowing users to achieve it with minimal coding effort. These libraries serve as the basis for the QGIS Geo-SAM plugin and the integration of the model in ArcGIS Pro.
En la imagen se pueden observar los resultados de aplicar las distintas segmentaciones a una imagen satelital. La segmentación semántica devuelve una categoría por cada tipo de objeto identificado. La segmentación por instancia devuelve los objetos individualizados y la caja delimitadora y, en la segmentación panóptica, obtenemos los objetos individualizados y el contexto también diferenciado, pudiendo detectar el suelo y la región de calles.

Conclusions
In summary, SAM represents a significant revolution not only for the possibilities it opens in terms of editing photos or extracting elements from images for collages or video editing but also for the opportunities it provides to enhance computer vision when using augmented reality glasses or virtual reality headsets.
SAM also marks a revolution in spatial information acquisition, improving object detection through satellite imagery and facilitating the rapid detection of changes in the territory.
Content created by Mayte Toscano, Senior Consultant in Data Economy Technologies.
The content and viewpoints reflected in this publication are the sole responsibility of the author.
Blog
The combination and integration of open data with artificial intelligence (AI) is an area of work that has the potential to achieve significant advances in multiple fields and bring improvements to various aspects of our lives. The most frequently mentioned area of synergy is the use of open data as input for training the algorithms used by AI since these systems require large amounts of data to fuel their operations. This makes open data an essential element for AI development and utilizing it as input brings additional advantages such as increased equality of access to technology and improved transparency regarding algorithmic functioning.
Today, we can find open data powering algorithms for AI applications in diverse areas such as crime prevention, public transportation development, gender equality, environmental protection, healthcare improvement, and the creation of more friendly and liveable cities. All of these objectives are more easily attainable through the appropriate combination of these technological trends.
However, as we will see next, when envisioning the joint future of open data and AI, the combined use of both concepts can also lead to many other improvements in how we currently work with open data throughout its entire lifecycle. Let's review step by step how artificial intelligence can enrich a project with open data.
Utilizing AI to Discover Sources and Prepare Data Sets
Artificial intelligence can assist right from the initial steps of our data projects by supporting the discovery and integration of various data sources, making it easier for organizations to find and use relevant open data for their applications. Furthermore, future trends may involve the development of common data standards, metadata frameworks, and APIs to facilitate the integration of open data with AI technologies, further expanding the possibilities of automating the combination of data from diverse sources.
In addition to automating the guided search for data sources, AI-driven automated processes can be helpful, at least in part, in the data cleaning and preparation process. This can improve the quality of open data by identifying and correcting errors, filling gaps in the data, and enhancing its completeness. This would free scientists and data analysts from certain basic and repetitive tasks, allowing them to focus on more strategic activities such as developing new ideas and making predictions.
Innovative Techniques for Data Analysis with AI
One characteristic of AI models is their ability to detect patterns and knowledge in large amounts of data. AI techniques such as machine learning, natural language processing, and computer vision can easily be used to extract new perspectives, patterns, and knowledge from open data. Moreover, as technological development continues to advance, we can expect the emergence of even more sophisticated AI techniques specifically tailored for open data analysis, enabling organizations to extract even more value from it.
Simultaneously, AI technologies can help us go a step further in data analysis by facilitating and assisting in collaborative data analysis. Through this process, multiple stakeholders can work together on complex problems and find answers through open data. This would also lead to increased collaboration among researchers, policymakers, and civil society communities in harnessing the full potential of open data to address social challenges. Additionally, this type of collaborative analysis would contribute to improving transparency and inclusivity in decision-making processes.
The Synergy of AI and Open Data
In summary, AI can also be used to automate many tasks involved in data presentation, such as creating interactive visualizations simply by providing instructions in natural language or a description of the desired visualization.
On the other hand, open data enables the development of applications that, combined with artificial intelligence, can provide innovative solutions. The development of new applications driven by open data and artificial intelligence can contribute to various sectors such as healthcare, finance, transportation, or education, among others. For example, chatbots are being used to provide customer service, algorithms for investment decisions, or autonomous vehicles, all powered by AI. By using open data as the primary data source for these services, we would achieve higher
Finally, AI can also be used to analyze large volumes of open data and identify new patterns and trends that would be difficult to detect through human intuition alone. This information can then be used to make better decisions, such as what policies to pursue in each area to bring about the desired changes.
These are just some of the possible future trends at the intersection of open data and artificial intelligence, a future full of opportunities but at the same time not without risks. As AI continues to develop, we can expect to see even more innovative and transformative applications of this technology. This will also require closer collaboration between artificial intelligence researchers and the open data community in opening up new datasets and developing new tools to exploit them. This collaboration is essential in order to shape the future of open data and AI together and ensure that the benefits of AI are available to all in a fair and equitable way.
Content prepared by Carlos Iglesias, Open data Researcher and consultant, World Wide Web Foundation.
The contents and views reflected in this publication are the sole responsibility of the author.