


Documentation
Type
Audience
Document date
Tag
-
Generating personalized tourist map with "Google My Maps"
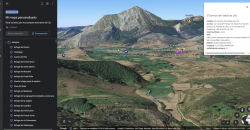
1. Introduction 2. Objective 3. Resources 3.1. Datasets 3.2. Tools 4. Data processing and preparation 5. Data enrichment 6. Map visualization 6.1. Map generation with "Google My Maps" 6.2. Personalization of the information to be...
-
Analysis of toxicological findings in road traffic accidents
1. Introduction 2. Objetive 3. Resources 3.1. Datasets 3.2. Tools 4. Data processing or preparation 5. Generating visualizations 5.1. Fleet of vehicles registered by Autonomous Communities and by type of vehicle 5.2. Ratio of...
-
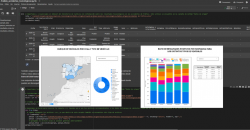
Analysis of the state and evolution of the national water reservoirs

1. Introduction 2. Objetives 3. Resources 3.1. Datasets 3.2. Tools 4. Data enrichment 5. Data pre-processing 6. Data visualization 6.1. Geographic location and main information on each reservoir 6.2. Water reserve between the years...
-
Features for the creation of data spaces

A data space is an ecosystem where, on a voluntary basis, the data of its participants (public sector, large and small technology or business companies, individuals, research organizations, etc.) are pooled. Thus, under a context of sovereignty, trust...
-
Characteristics of the Spanish University students and most demanded degrees

1. Introduction 2. Objetives 3. Resources 3.1. Datasets 3.2. Tools 4. Data pre-processing 5. Visualizations 6. Conclusions 1. Introduction Visualizations are graphical representations of data that allow to transmit in a...
-
How to deal with a data analysis project?

By analysing data, we can discover meaningful patterns and gain insights that lead to informed decision making. But good data analysis needs to be methodical and follow a series of steps in an orderly fashion. In this video (in Spanish) we give you some...
-
Creating word clouds from the text data with NLP techniques
1. Introduction 2. Objetives 3. Resources 3.1. Tools 3.2. Datasets 4. Data processing 5. Creation of the world cloud 6. Conclusions 1. Introduction Visualizations are a graphic representation that allow us to comprehend in...
-
How many accidents occur in the city of Madrid?
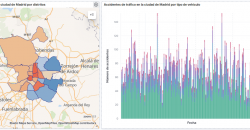
1. Introduction 2. Objetives 3. Resources 3.1. Datasets 3.2. Tools 4. Data processing 5. Visualizations 6. Conclusions 1. Introduction Data visualization is a task linked to data analysis that aims to...
-
Teachers of public schools in Castilla y León
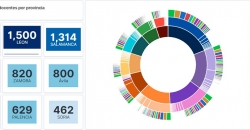
1. Introductionction 2. Objetiveses 3. Resources 3.1. Datasets 3.2. Tools 4. Data processing 5. Visualizationtion 6. Conclusions 1. Introduction Data visualization is a task linked to data analysis that aims to...
-
A practical introductory guide to exploratory data analysis
Before performing data analysis, for statistical or predictive purposes, for example through machine learning techniques, it is necessary to understand the raw material with which we are going to work. It is necessary to understand and evaluate the...


