Blog
Open health data is one of the most valuable assets of our society. Well managed and shared responsibly, they can save lives, drive medical discoveries, or even optimize hospital resources. However, for decades, this data has remained fragmented in institutional silos, with incompatible formats and technical and legal barriers that made it difficult to reuse. Now, the European Union is radically changing the landscape with an ambitious strategy that combines two complementary approaches:
- Facilitate open access to statistics and non-sensitive aggregated data.
- Create secure infrastructures to share personal health data under strict privacy guarantees.
In Spain, this transformation is already underway through the National Health Data Space or research groups that are at the forefront of the innovative use of health data. Initiatives such as IMPACT-Data, which integrates medical data to drive precision medicine, demonstrate the potential of working with health data in a structured and secure way. And to make it easier for all this data to be easy to find and reuse, standards such as HealthDCAT-AP are implemented.
All this is perfectly aligned with the European strategy of the European Health Data Space Regulation (EHDS), officially published in March 2025, which is also integrated with the Open Data Directive (ODD), in force since 2019. Although the two regulatory frameworks have different scopes, their interaction offers extraordinary opportunities for innovation, research and the improvement of healthcare across Europe.
A recent report prepared by Capgemini Invent for data.europa.eu analyzes these synergies. In this post, we explore the main conclusions of this work and reflect on its relevance for the Spanish open data ecosystem.
-
Two complementary frameworks for a common goal
On the one hand, the European Health Data Space focuses specifically on health data and pursues three fundamental objectives:
- Facilitate international access to health data for patient care (primary use).
- Promote the reuse of this data for research, public policy, and innovation (secondary use).
- Technically standardize electronic health record (EHR) systems to improve cross-border interoperability.

For its part, the Open Data Directive has a broader scope: it encourages the public sector to make government data available to any user for free reuse. This includes High-Value Datasets that must be published for free, in machine-readable formats, and via APIs in six categories that did not originally include "health." However, in the proposal to expand the new categories published by the EU, the health category does appear.
The complementarity between the two regulatory frameworks is evident: while the ODD facilitates open access to aggregated and non-sensitive health statistics, the EHDS regulates controlled access to individual health data under strict conditions of security, consent and governance. Together, they form a tiered data sharing system that maximizes its social value without compromising privacy, in full compliance with the General Data Protection Regulation (GDPR).
Main benefits computer by user groups
The report looks at four main user groups and examines both the potential benefits and challenges they face in combining EHDS data with open data.
-
Patients: Informed Empowerment with Practical Barriers
European patients will gain faster and more secure access to their own electronic health records, especially in cross-border contexts thanks to infrastructures such as MyHealth@EU. This project is particularly useful for European citizens who are displaced in another European country. .
Another interesting project that informs the public is PatientsLikeMe, which brings together more than 850,000 patients with rare or chronic diseases in an online community that shares information of interest about treatments and other issues.
-
Potential health professionals subordinate to integration
On the other hand, healthcare professionals will be able to access clinical patient data earlier and more easily, even across borders, improving continuity of care and the quality of diagnosis and treatment.
The combination with open data could amplify these benefits if tools are developed that integrate both sources of information directly into electronic health record systems.
3. Policymakers: data for better decisions
Public officials are natural beneficiaries of the convergence between EHDS and open data. The possibility of combining detailed health data (upon request and authorisation through the Health Data Access Bodies that each Member State must establish) with open statistical and contextual information would allow for much more robust evidence-based policies to be developed.
The report mentions use cases such as combining health data with environmental information to assess health impacts. A real example is the French Green Data for Health project, which crosses open data on noise pollution with information on prescriptions for sleep medications from more than 10 million inhabitants, investigating correlations between environmental noise and sleep disorders.
4. Researchers and reusers: the main immediate beneficiaries
Researchers, academics and innovators are the group that will most directly benefit from the EHDS-ODD synergy as they have the skills and tools to locate, access, combine and analyse data from multiple sources. In addition, their work already routinely involves the integration of various data sets.
A recent study published in PLOS Digital Health on the case of Andalusia demonstrates how open data in health can democratize research in health AI and improve equity in treatment.
The development of EHDS is being supported by European programmes such as EU4Health, Horizon Europe and specific projects such as TEHDAS2, which help to define technical standards and pilot real applications.
-
Recommendations to maximize impact
The report concludes with four key recommendations that are particularly relevant to the Spanish open data ecosystem:
- Stimulate research at the EHDS-open data intersection through dedicated funding. It is essential to encourage researchers who combine these sources to translate their findings into practical applications: improved clinical protocols, decision tools, updated quality standards.
- Evaluate and facilitate direct use by professionals and patients. Promoting data literacy and developing intuitive applications integrated into existing systems (such as electronic health records) could change this.
- Strengthen governance through education and clear regulatory frameworks. As EHDS technical entities become operationalized, clear regulation defining common regulatory frameworks will be essential.
- Monitor, evaluate and adapt. The period 2025-2031 will see the gradual entry into force of the various EHDS requirements. Regular evaluations are recommended to assess how EHDS is actually being used, which combinations with open data are generating the most value, and what adjustments are needed.
Moreover, for all this to work, the report suggests that portals such as data.europa.eu (and by extension, datos.gob.es) should highlight practical examples that demonstrate how open data complements protected data from sectoral spaces, thus inspiring new applications.
Overall, the role of open data portals will be fundamental in this emerging ecosystem: not only as providers of quality datasets, but also as facilitators of knowledge, meeting spaces between communities and catalysts for innovation. The future of European healthcare is now being written, and open data plays a leading role in that story.
Blog
The European Union aims to boost the Data Economy by promoting the free flow of data between member states and between strategic sectors, for the benefit of businesses, researchers, public administrations and citizens. Undoubtedly, data is a critical factor in the industrial and technological revolution we are experiencing, and therefore one of the EU's digital priorities is to capitalise on its latent value, relying on a single market where data can be shared under conditions of security and, above all, sovereignty, as this is the only way to guarantee indisputable European values and rights.
Thus, the European Data Strategy seeks to enhance the exchange of data on a large scale, under distributed and federated environments, while ensuring cybersecurity and transparency. To achieve scale, and to unlock the full potential of data in the digital economy, a key element is building trust. This, as a basic element that conditions the liquidity of the ecosystem, must be developed coherently across different areas and among different actors (data providers, users, intermediaries, service platforms, developers, etc.). Therefore, their articulation affects different perspectives, including business and functional, legal and regulatory, operational, and even technological. Therefore, success in these highly complex projects depends on developing strategies that seek to minimise barriers to entry for participants, and maximise the efficiency and sustainability of the services offered. This in turn translates into the development of data infrastructures and governance models that are easily scalable, and that provide the basis for effective data exchange to generate value for all stakeholders.
A methodology to boost data spaces
Spain has taken on the task of putting this European strategy into practice, and has been working for years to create an environment conducive to facilitating the deployment and establishment of a Sovereign Data Economy, supported, among other instruments, by the Recovery, Transformation and Resilience Plan. In this sense, and from its coordinating and enabling role, the Data Office has made efforts to design a general conceptual methodology , agnostic to a specific sector. It shapes the creation of data ecosystems around practical projects that bring value to the members of the ecosystem.
Therefore, the methodology consists of several elements, one of them being experimentation. This is because, by their flexible nature, data can be processed, modelled and thus interpreted from different perspectives. For this reason, experimentation is key to properly calibrate those processes and treatments needed to reach the market with pilots or business cases already close to the industries, so that they are closer to generating a positive impact. In this sense, it is necessary to demonstrate tangible value and underpin its sustainability, which implies, as a minimum, having:
- Frameworks for effective data governance
- Actions to improve the availability and quality of data, also seeking to increase their interoperability by design
- Tools and platforms for data exchange and exploitation.
Furthermore, given that each sector has its own specificity in terms of data types and semantics, business models, and participants' needs, the creation of communities of experts, representing the voice of the market, is another key element in generating useful projects. Based on this active listening, which leads to an understanding of the dynamics of data in each sector, it is possible to characterise the market and governance conditions necessary for the deployment of data spaces in strategic sectors such as tourism, mobility, agri-food, commerce, health and industry.
In this process of community building, data co-operatives play a fundamental role, as well as the more general figure of the data broker, which serves to raise awareness of the existing opportunity and favour the effective creation and consolidation of these new business models.
All these elements are different pieces of a puzzle with which to explore new business development opportunities, as well as to design tangible projects to demonstrate the differential value that data sharing will bring to the reality of industries. Thus, from an operational perspective, the last element of the methodology is the development of concrete use cases. These will also allow the iterative deployment of a catalogue of reusable experience and data resources in each sector to facilitate the construction of new projects. This catalogue thus becomes the centrepiece of a common sectoral and federated platform, whose distributed architecture also facilitates cross-sectoral interconnection.
On the shoulders of giants
It should be noted that Spain is not starting from scratch, as it already has a powerful ecosystem of innovation and experimentation in data, offering advanced services. We therefore believe it would be interesting to make progress in the harmonisation or complementarity of their objectives, as well as in the dissemination of their capacities in order to gain capillarity. Furthermore, the proposed methodology reinforces the alignment with European projects in the same field, which will serve to connect learning and progress from the national level to those made at EU level, as well as to put into practice the design tasks of the "cyanotypes" promulgated by the European Commission through the Data Spaces Support Centre.
Finally,the promotion of experimental or pilot projects also enables the development of standards for innovative data technologies, which is closely related to the Gaia-X project. Thus, the Gaia-X Hub Spain has an interoperability node, which serves to certify compliance with the rules prescribed by each sector, and thus to generate the aforementioned digital trust based on their specific needs.
At the Data Office, we believe that the interconnection and future scalability of data projects are at the heart of the effort to implement the European Data Strategy, and are crucial to achieve a dynamic and rich Data Economy, but at the same time a guarantor of European values and where traceability and transparency help to collectivise the value of data, catalysing a stronger and more cohesive economy.
Blog
The European Open Science Cloud (EOSC) is a European Union initiative that aims to promote open science through the creation of an open, collaborative and sustainabledigital research infrastructure. EOSC's main objective is to provide European researchers with easier access to the data, tools and resources they need to conduct quality research.
EOSC on the European Research and Data Agenda
EOSC is part of the 20 actions of the European Research Area (ERA) agenda 2022-2024 and is recognised as the European data space for science, research and innovation, to be integrated with other sectoral data spaces defined in the European data strategy. Among the expected benefits of the platform are the following:
- An improvement in the confidence, quality and productivity of European science.
- The development of new innovative products and services.
- Improving the impact of research in tackling major societal challenges.
The EOSC platform
EOSC is in fact an ongoing process that sets out a roadmap in which all European states participate, based on the central idea that research data is a public good that should be available to all researchers, regardless of their location or affiliation. This model aims to ensure that scientific results comply with the FAIR (Findable, Accessible, Interoperable, Reusable) Principles to facilitate reuse, as in any other data space.
However, the most visible part of EOSC is its platform that gives access to millions of resources contributed by hundreds of content providers. This platform is designed to facilitate the search, discovery and interoperability of data and other content such as training resources, security, analysis, tools, etc. To this end, the key elements of the architecture envisaged in EOSC include two main components:
- EOSC Core: which provides all the basic elements needed to discover, share, access and reuse resources - authentication, metadata management, metrics, persistent identifiers, etc.
- EOSC Exchange: to ensure that common and thematic services for data management and exploitation are available to the scientific community.
In addition, the ESOC Interoperability Framework (EOSC-IF)is a set of policies and guidelines that enable interoperability between different resources and services and facilitate their subsequent combination.
The platform is currently available in 24 languages and is continuously updated to add new data and services. Over the next seven years, a joint investment by the EU partners of at least EUR 1 billion is foreseen for its further development.
Participation in EOSC
The evolution of EOSC is being guided by a tripartite coordinating body consisting of the European Commission itself, the participating countries represented on the EOSC Steering Board and the research community represented through the EOSC Association. In addition, in order to be part of the ESCO community, you only have to follow a series of minimum rules of participation:
- The whole EOSC concept is based on the general principle of openness.
- Existing EOSC resources must comply with the FAIR principles.
- Services must comply with the EOSC architecture and interoperability guidelines.
- EOSC follows the principles of ethical behaviour and integrity in research.
- EOSC users are also expected to contribute to EOSC.
- Users must comply with the terms and conditions associated with the data they use.
- EOSC users always cite the sources of the resources they use in their work.
- Participation in EOSC is subject to applicable policies and legislation.
EOSC in Spain
The Consejo Superior de Investigaciones Científicas (CSIC) of Spain was one of the 4 founding members of the association and is currently a commissioned member of the association, in charge of coordination at national level.
CSIC has been working for years on its open access repository DIGITAL.CSIC as a step towards its future integration into EOSC. Within its work in open science we can highlight for example the adoption of the Current Research Information System (CRIS), information systems designed to help research institutions to collect, organise and manage data on their research activity: researchers, projects, publications, patents, collaborations, funding, etc.
CRIS are already important tools in helping institutions track and manage their scientific output, promoting transparency and open access to research. But they can also play an important role as sources of information feeding into the EOSC, as data collected in CRIS can also be easily shared and used through the EOSC.
The road to open science
Collaboration between CRIS and ESCO has the potential to significantly improve the accessibility and re-use of research data, but there are also other transitional actions that can be taken on the road to producing increasingly open science:
- Ensure the quality of metadata to facilitate open data exchange.
- Disseminate the FAIR principles among the research community.
- Promote and develop common standards to facilitate interoperability.
- Encourage the use of open repositories.
- Contribute by sharing resources with the rest of the community.
This will help to boost open science, increasing the efficiency, transparency and replicability of research.
Content prepared by Carlos Iglesias, Open data Researcher and consultant, World Wide Web Foundation.
The contents and points of view reflected in this publication are the sole responsibility of its author.
Blog
Europe is developing a common data space for tourism, aiming to integrate various stakeholders, including local and regional authorities, the private sector, and multiple member states. Spain is among them, where several workshops have already been conducted as part of the process to energize the national tourism data space, focusing on discussing the challenges, opportunities, and use cases in the sector.
The future tourism data space is at the core of the transition towards greater sustainability and profound digitization in the tourism sector. This initiative is also aligned with the European data strategy, which envisions creating a single market where information can be freely shared, promoting innovation across different economic sectors and certain areas of public interest. Furthermore, future data spaces hold significant importance in Europe's quest to regain digital sovereignty, reasserting control over data, fostering innovation, and the ability to develop and implement its own legislation in the digital environment.
Even in last year's conference on the Future of the European Union, the importance of data spaces in sectors like tourism and mobility was highlighted, recognizing them as key sectors in the digital transformation. Tourism, in particular, stands to benefit greatly from such initiatives due to its dynamic and ever-evolving nature, heavily reliant on user experiences and the timely access to necessary information.
Therefore, the European common data space for tourism aims to boost data exchange and reuse, establishing a governance model that respects existing legislation. The ultimate goal is to benefit all stakeholders in various ways, including:
- Promoting innovation in the sector by enhancing and personalizing services through access to high-quality information.
- Assisting public authorities in making data-driven decisions for the sustainability of their tourism offerings.
- Supporting specialized businesses in providing better services based on data analysis and market trends.
- Facilitating market access for sector businesses in Europe.
- Improving data availability for the creation of high-quality official statistics.
However, there are several challenges in sharing existing data in the tourism sector, primarily stemming from concerns regarding reciprocity and data reuse. These challenges can be summarized as follows:
- Data interoperability: Designing and managing a European tourist experience involves handling a wide array of non-personal data across various domains like mobility, environmental management, or cultural heritage, all of which enrich the tourist experience. The primary challenge in this regard is the ability to share and cross-reference information from different sources without duplications, with a reference framework that promotes interoperability between different sectors, utilizing existing standards where possible.
- Data access: Unlike other sectors, the European Union's tourism ecosystem lacks a single marketplace platform. Various offerings are modeled and cataloged by different actors, both public and private, at national, regional, or local levels. While the tourism data space does not aim to serve as a central booking node, it can greatly contribute by providing effective information search tools, facilitating access to necessary data, decision-making, and fostering innovation in the sector.
- Data provision by public and private entities: There is a wide variety of data in this sector, from open data like schedules and weather conditions to private and commercial data such as search, bookings, and payments. A significant portion of these commercial data are managed by a small group of large private entities, making it necessary to establish inclusive dialogue for fair and appropriate rules on data access within the shared data space.
To consolidate this initiative, the Transition Path for Tourism emphasizes the need to advance in the creation and optimization of a specific data space for the tourism sector. This aims to modernize and enhance this crucial economic sector in Europe through key actions:
- Governance: The governance of the tourism data space will determine how the main enablers will relate to ensure interoperability. The goal is to ensure that data is accessed, shared, and used lawfully, fairly, transparently, proportionally, and without discrimination to build trust, support research, and foster innovation within the sector.
- Semantics for interoperability: Common data models and vocabularies are needed for effective interoperability. National statistical agencies and Eurostat already have some consensus definitions, but their adoption within the tourism sector remains uneven. Therefore, clarifying definitions within the multilingual European context is crucial to establish a common European data model, accompanied by implementation guidelines. Spain has already made pioneering efforts in semantic interoperability, such as the development of the Tourism Ontology, technical standards for semantic applied to smart tourism destinations, or the model for collecting, exploiting, and analyzing tourism data.
- Technical standards for interoperability: The Data Spaces Support Center (DSSC) is already working to identify common technical standards that can be reused, taking into account existing or ongoing initiatives and regulatory frameworks. Additionally, all data spaces will also benefit from Simpl, a cloud federation middleware that will serve as a foundation for major data initiatives funded by the European Commission. Furthermore, there are specific technical standards in the sector, such as those developed by Eurostat for sharing accommodation data.
- Defining the role of the private sector: The European common data space for tourism will clearly benefit from cooperation with the private sector and the market for new services and tools it can offer. Some platforms already share data with Eurostat, and new agreements are being developed to share other non-personal tourism data, along with the creation of a new code of conduct to foster trust among various stakeholders.
- Supporting SMEs in the transition to a data space: The European Commission has long provided specific support to SMEs through Digital Innovation Hubs (DIHs) and the Enterprise Europe Network (EEN), offering technical and financial support, as well as assistance in developing new digital skills. Some of these centers specialize in tourism. Additionally, the European Tourism Enterprises Network (SGT), with 61 members in 23 countries, also provides support for digitalization and internationalization. This support for SMEs is particularly relevant given that they represent nearly all of the companies in the tourism sector, specifically 99.9%, of which 91% are microenterprises.
- Supporting tourism destinations in the transition to a data space: Tourism destinations must integrate tourism into their urban plans to ensure sustainable and beneficial tourism for residents and the environment. Several Commission initiatives enhance the availability of necessary information for tourism management and the exchange of best practices, promoting cooperation among destinations and proposing actions to improve digital services.
- Proof of concept for the tourism data space: The European Commission, along with several member states and private actors, is currently conducting a series of pilot tests for tourism data spaces through the DSFT and DATES coordination and support actions (CSAs). The main goal of these tests is to align with existing technical standards for accommodation data and demonstrate the value of interoperability and business models that arise from data sharing through a realistic and inclusive approach, focusing on short-term rentals and accommodation. In Spain, the report on the state of the tourism data space explains the current status of the national data space design.
In conclusion, the European Commission is firmly committed to supporting the creation of a space where tourism-related data flows while respecting the principles of fairness, accessibility, security, and privacy, in line with the European data strategy and the Pact for Skills development. The goal is to build a common data space for tourism that is progressive, robust, and integrated within the existing interoperability framework. To achieve this, the Commission urges all stakeholders to share data for the mutual benefit of everyone involved in an ecosystem that will be crucial for the entire European economy.
At the end of October, there will also be a new opportunity to learn more about the tourism data space and the challenges associated with data spaces in general, through the European Big Data Value Forum in Valencia.
Content created by Carlos Iglesias, Open Data Researcher and Consultant, World Wide Web Foundation.
The content and viewpoints reflected in this publication are the sole responsibility of the author.
Blog
In the digital age, technological advancements have transformed the field of medical research. One of the factors contributing to technological development in this area is data, particularly open data. The openness and availability of information obtained from health research provide multiple benefits to the scientific community. Open data in the healthcare sector promotes collaboration among researchers, accelerates the validation process of study results, and ultimately helps save lives.
The significance of this type of data is also evident in the prioritized intention to establish the European Health Data Space (EHDS), the first common EU data space emerging from the European Data Strategy and one of the priorities of the Commission for the 2019-2025 period. As proposed by the European Commission, the EHDS will contribute to promoting better sharing and access to different types of health data, not only to support healthcare delivery but also for health research and policymaking.
However, the handling of this type of data must be appropriate due to the sensitive information it contains. Personal data related to health is considered a special category by the Spanish Data Protection Agency (AEPD), and a personal data breach, especially in the healthcare sector, has a high personal and social impact.
To avoid these risks, medical data can be anonymized, ensuring compliance with regulations and fundamental rights, thereby protecting patient privacy. The Basic Anonymization Guide developed by the AEPD based on the Personal Data Protection Commission Singapore (PDPC) defines key concepts of an anonymization process, including terms, methodological principles, types of risks, and existing techniques.
Once this process is carried out, medical data can contribute to research on diseases, resulting in improvements in treatment effectiveness and the development of medical assistance technologies. Additionally, open data in the healthcare sector enables scientists to share information, results, and findings quickly and accessibly, thus fostering collaboration and study replicability.
In this regard, various institutions share their anonymized data to contribute to health research and scientific development. One of them is the FISABIO Foundation (Foundation for the Promotion of Health and Biomedical Research of the Valencian Community), which has become a reference in the field of medicine thanks to its commitment to open data sharing. As part of this institution, located in the Valencian Community, there is the FISABIO-CIPF Biomedical Imaging Unit, which is dedicated, among other tasks, to the study and development of advanced medical imaging techniques to improve disease diagnosis and treatment.
This research group has developed different projects on medical image analysis. The outcome of all their work is published under open-source licenses: from the results of their research to the data repositories they use to train artificial intelligence and machine learning models.
To protect sensitive patient data, they have also developed their own techniques for anonymizing and pseudonymizing images and medical reports using a Natural Language Processing (NLP) model, whereby anonymized data can be replaced by synthetic values. Following their technique, facial information from brain MRIs can be erased using open-source deep learning software.
BIMCV: Medical Imaging Bank of the Valencian Community
One of the major milestones of the Regional Ministry of Universal Health and Public Health, through the Foundation and the San Juan de Alicante Hospital, is the creation and maintenance of the Medical Imaging Bank of the Valencian Community, BIMCV (Medical Imaging Databank of the Valencia Region in English), a repository of knowledge aimed at achieving "technological advances in medical imaging and providing technological coverage services to support R&D projects," as explained on their website.
BIMCV is hosted on XNAT, a platform that contains open-source images for image-based research and is accessible by prior registration and/or on-demand. Currently, the Medical Imaging Bank of the Valencian Community includes open data from research conducted in various healthcare centers in the region, housing data from over 90,000 subjects collected in more than 150,000 sessions.
New Dataset of Radiological Images
Recently, the FISABIO-CIPF Biomedical Imaging Unit and the Prince Felipe Research Center (FISABIO-CIPF) released in open access the third and final iteration of data from the BIMCV-COVID-19 project. They released image data of chest radiographs taken from patients with and without COVID-19, as well as the models they had trained for the detection of different chest X-ray pathologies, thanks to the support of the Regional Ministry of Innovation, the Regional Ministry of Health and the European Union REACT-EU Funds. All of this was made available "for use by companies in the sector or simply for research purposes," explains María de la Iglesia, director of the unit. "We believe that reproducibility is of great relevance and importance in the healthcare sector," she adds. The datasets and the results of their research can be accessed here.
The findings are mapped using the standard terminology of the Unified Medical Language System (UMLS), as proposed by the results of Dr. Aurelia Bustos' doctoral thesis, an oncologist and computer engineer. They are stored in high resolution with anatomical labels in a Medical Image Data Structure (MIDS) format. Among the stored information are patient demographic data, projection type, and imaging study acquisition parameters, among others, all anonymized.
The contribution that such open data projects make to society not only benefits researchers and healthcare professionals but also enables the development of solutions that can have a significant impact on improving healthcare. One of these solutions can be generative AI, which provides interesting results that healthcare professionals can consider in personalized diagnosis and propose more effective treatment, prioritizing their own judgment.
On the other hand, the digitization of healthcare systems is already a reality, including 3D printing, digital twins applied to medicine, telemedicine consultations, or portable medical devices. In this context, the collaboration and sharing of medical data, provided their protection is ensured, contribute to promoting research and innovation in the sector. In other words, open data initiatives for medical research stimulate technological advancements in healthcare.
Therefore, the FISABIO Foundation, together with the Prince Felipe Research Center, where the platform hosting BIMCV is located, stands out as an exemplary case in promoting the openness and sharing of data in the field of medicine. As the digital age progresses, it is crucial to continue promoting data openness and encouraging its responsible use in medical research, for the benefit of society.
Blog
We live in the era of data, a lever of digital transformation and a strategic asset for innovation and the development of new technologies and services. Data, beyond the skills it brings to the generator and/or owner of the same, also has the peculiarity of being a non-rival asset. This means that it can be reused without detriment to the owner of the original rights, which makes it a resource with a high degree of scalability in its sharing and exploitation.
This possibility of non-rival sharing, in addition to opening potential new lines of business for the original owners, also carries a huge latent value for the development of new business models. And although sharing is not new, it is still very limited to niche contexts of sector specialisation, mediated either by trust between parties (usually forged in advance), or tedious and disciplined contractual conditions. This is why the innovative concept of data space has emerged, which in its most simplified sense is nothing more than the modelling of the general conditions under which to deploy a voluntary, sovereign and secure sharing of data. Once modelled, the prescription of considerations and methodologies (technological, organisational and operational) allows to make such sharing tangible based on peer-to-peer interactions, which together shape federated ecosystems of data sets and services.
Therefore, and given the distributed nature of data spaces (they are not a monolithic computer system, nor a centralised platform), an optimal way to approach their construction is through the creation and deployment of use cases.
The Data Office has created this infographic of a 'Model of use case development within data spaces', with the objective of synthetically defining the phases of this iterative journey, which progressively shapes a data space. This model also serves as a general framework for other technical and methodological deliverables to come, such as the 'Use Case Feasibility Assessment Guide', or the 'Use Case Design Guide', elements with which to facilitate the implementation of practical (and scalable by design) data sharing experiences, a sine qua non condition to articulate the longed-for European single data market.
The challenge of building a data space
To make the process of developing a data space more accessible, we could assimilate the definition and construction of a use case as a construction project, in which from an initial business problem (needs or challenges, desires, or problems to be solved) a goal is reached in which value is added to the business, providing a solution to those initial needs. This infographic offers a synthesis of that journey.

These are the phases of the model:
PHASE 1: Definition of the business problem. In this phase a group of potential participants detects an opportunity around the sharing of their data (hitherto siloed) and its corresponding exploitation. This opportunity can be new products or services (innovation), efficiency improvements, or the resolution of a business problem. In other words, there is a business objective that the group can solve jointly, by sharing data.
PHASE 2: Data-driven modelling. In this phase, those elements that serve to structure and organise the data for strategic decision-making based on its exploitation will be identified. It involves defining a model that possibly uses multidisciplinary tools to achieve business results. This is the part traditionally associated with data science tasks.
PHASE 3: Consensus on requirements specification. Here, the actors sponsoring the use case must establish the relationship model to have during this collaborative project around the data. Such a formula must: (i) define and establish the rules of engagement, (ii) define a common set of policies and governance model, and (iii) define a trust model that acts as the root of the relationship.
PHASES 4 and 5: Use case mapping. As in a construction project, the blueprint is the means of expressing the ideas of those who have defined and agreed the use case, and should explicitly capture the solutions proposed for each part of the use case development. This plan is unique for each use case, and phase 5 corresponds to its construction. However, it is not created from scratch, but there are multiple references that allow the use of previously identified materials and techniques. For example, models, methodologies, artefacts, templates, technological components or solutions as a service. Thus, just as an architect designing a building can reuse recognised standards, in the world of data spaces there are also models on which to paint the components and processes of a use case. The analysis and synthesis of these references is phase 4.
PHASE 6: Technology selection, parameterisation and/or development. The technology enables the deployment of the transformation and exploitation of the data, favouring the entire life cycle, from its collection to its valorisation. In this phase, the infrastructure that supports the use case is implemented, understood as the collection of tools, platforms, applications and/or pieces of software necessary for the operation of the application.
PHASE 7: Integration, testing and deployment. Like any technological construction process, the use case will go through the phases of integration, testing and deployment. The integration work and the functional, usability, exploratory and acceptance tests, etc. will help us to achieve the desired configuration for the operational deployment of the use case. In the case of wanting to incorporate a use case into a pre-existing data space, the integration would seek to fit within its structure, which means modelling the requirements of the use case within the processes and building blocks of the data space.
PHASE 8: Operational data space. The end point of this journey is the operational use case, which will employ digital services deployed on top of the data space structure, and whose architecture supports different resources and functionalities federated by design. This implies that the value creation lifecycle would have been efficiently articulated based on the shared data, and business returns are achieved according to the original approach. However, this does not prevent the data space from continuing to evolve a posteriori, as its vocation is to grow either with the entry of new challenges, or actors to existing use cases. In fact, the scalability of the model is one of its unique strengths.
In essence, the data shared through a federated and interoperable ecosystem is the input that feeds a layer of services that will generate value and solve the original needs and challenges posed, in a journey that goes from the definition of a business problem to its resolution.
Blog
Behind a voice-enabled virtual assistant, a movie recommendation on a streaming platform, or the development of some COVID-19 vaccines, there are machine learning models. This branch of artificial intelligence enables systems to learn and improve their performance.
Machine learning (ML) is one of the fields driving technological progress today, and its applications are growing every day. Examples of solutions developed with machine learning include DALL-E, the set of language models in Spanish known as MarIA, and even Chat GPT-3, a generative AI tool capable of creating content of all types, such as code for programming data visualizations from the datos.gob.es catalog.
All of these solutions work thanks to large data repositories that make system learning possible. Among these, open data plays a fundamental role in the development of artificial intelligence as it can be used to train machine learning models.
Based on this premise, along with the ongoing effort of governments to open up data, there are non-governmental organizations and associations that contribute by developing applications that use machine learning techniques aimed at improving the lives of citizens. We highlight three of them:
ML Commons is driving a better machine learning system for everyone
This initiative aims to improve the positive impact of machine learning on society and accelerate innovation by offering tools such as open datasets, best practices, and algorithms. Its founding members include companies such as Google, Microsoft, DELL, Intel AI, Facebook AI, among others.
According to ML Commons, around 80% of research in the field of machine learning is based on open data. Therefore, open data is vital to accelerate innovation in this field. However, nowadays, "most public data files available are small, static, legally restricted, and not redistributable," as David Kanter, director of ML Commons, assures.
In this regard, innovative ML technologies require large datasets with licenses that allow their reuse, that can be redistributed, and that are continually improving. Therefore, ML Commons' mission is to help mitigate that gap and thus promote innovation in machine learning.
The main goal of this organization is to create a community of open data for the development of machine learning applications. Its strategy is based on three pillars:
Firstly, creating and maintaining comprehensive open datasets, including The People's Speech, with over 30,000 hours of speech in English to train natural language processing (NLP) models, Multilingual Spoken Words, with over 23 million expressions in 50 different languages, or Dollar Street, with over 38,000 images of homes from around the world in various socio-economic situations. The second pillar involves promoting best practices that facilitate standardization, such as the MLCube project, which proposes standardizing the container process for ML models to facilitate shared use. Lastly, benchmarking in study groups to define benchmarks for the developer and research community.
Taking advantage of the benefits and being part of the ML Commons community is free for academic institutions and small companies (less than ten workers).
Datacommons synthesizes different sources of open data into a single portal
Datacommons aims to enhance democratic data flows within the cooperative and solidarity economy and its main objective is to offer purified, normalized, and interoperable data.
The variety of formats and information offered by public portals of open data can be a hindrance to research. The goal of Datacommons is to compile open data into an encyclopedic website that organizes all datasets through nodes. This way, users can access the source that interests them the most.
This platform, designed for educational and journalistic research purposes, functions as a reference tool for navigating through different sources of data. The team of collaborators works to keep the information up-to-date and interacts with the community through its email (support@datacommons.org) or GitHub forum.
Papers with Code: the open repository of materials to feed machine learning models
This is a portal that offers code, reports, data, methods, and evaluation tables in open and free format. All content on the website is licensed under CC-BY-SA, meaning it allows copying, distributing, displaying, and modifying the work, even for commercial purposes, by sharing the contributions made with the same original license.
Any user can contribute by providing content and even participate in the community's Slack channel, which is moderated by responsible individuals who protect the platform's defined inclusion policy.
As of today, Papers with Code hosts 7806 datasets that can be filtered by format (graph, text, image, tabular, etc.), task (object detection, queries, image classification, etc.), or language. The team maintaining Papers with Code belongs to the Meta Research Institute.
The goal of ML Commons, Data Commons, and Papers with Code is to maintain and grow open data communities that contribute to the development of innovative technologies, including artificial intelligence (machine learning, deep learning, etc.) with all the possibilities its development can offer to society.
As part of this process, the three organizations play a fundamental role: they offer standard and redistributable data repositories to train machine learning models. These are useful resources for academic exercises, promoting research, and ultimately facilitating the innovation of technologies that are increasingly present in our society.
Blog
A statistical graph is a visual representation designed to contain a series of data whose objective is to highlight a specific part of the reality. However, organising a set of data in an informative way is not an easy task, especially, if we want to capture the viewer’s attention and to present the information in an accurate format.
In order to facilitate comparisons between data it is required a minimum of statistical knowledge to highlight trends, to avoid misleading visualisation and to illustrate the message to be conveyed. Therefore, depending on the type of interrelation that exists between the data that we are trying to illustrate, we must choose one type of visualisation or another. In other words, representing a numerical classification is not the same as representing the degree of correlation between the two variables.
In order to precisely choose the most appropriate graphs according to the information, we have selected down the most recommended graphs for each type of association between numerical variablesv. During the process of preparing this content, we have taken as a reference the Data Visualisation Guide for local entities recently published by the FEMP's RED de Entidades Locales por la Transparencia y Participación Ciudadana, as well as this infography prepared by the Financial Times.

Deviation
It is used to highlight numerical variations from a fixed reference point. Usually, the reference point is zero, but it can also be a target or a long-term average. In addition, this type of graph is useful to show sentiments (positive, neutral or negative). The most common charts are:
- Diverging bar: A simple standard bar chart that can handle both negative and positive magnitude values.
- Column chart: Divides a single value into 2 contrasting components (e.g. male/female).
Correlation
Useful to show the relationship between two or more variables. Note that unless you tell them otherwise, many readers will assume that the relationships you show them are causal. Here are some of the graphs.
- Scatter plot: The standard way of showing the relationship between two continuous variables, each of which has its own axis.
- Timeline: A good way to show the relationship between a quantity (columns) and a ratio (line).
Sorting
Sorting numerical variables is necessary when the position of an item in an ordered list is more important than its absolute or relative value. The following graphs can be used to highlight points of interest.
- Bar chart: These types of visualisations allow ranges of values to be displayed in a simple way when they are sorted.
- Dot-strip chart: The values are arranged in a strip. This layout saves space for designing ranges in multiple categories.
Distribution
This type of graph seeks to highlight a series of values within a data set and represent how often they occur. That is, they are used to show how variables are distributed over time, which helps to identify outliers and trends.
The shape itself of a distribution can be an interesting way to highlight non-uniformity or equality in the data. The most recommended visualisations to represent, for example, are age or gender distribution are as follows:
- Histogram: This is the most common way of showing a statistical distribution. To develop it, it is recommended to keep a small space between the columns in order to highlight the "shape" of the data.
- Box plot: Effective for visualising multiple distributions by showing the median (centre) and range of the data.
- Population pyramid: Known for showing the distribution of the population by sex. In fact, it is a combination of two horizontal bar charts sharing the vertical axis.
Changes over time
Through this combination of numerical variables it is possible to emphasise changing trends. These can be short movements or extended series spanning decades or centuries. Choosing the right time period to represent is key to providing context for the reader.
- Line graph: This is the standard way to show a changing time series. If the data is very irregular it can be useful to use markers to help represent data points.
- Calendar heat map: Used to show temporal patterns (daily, weekly, monthly). It is necessary to be very precise with the amount of data.
Magnitude
It is useful for visualising size comparisons. These can be relative (simply being able to see bigger/larger) or absolute (requires seeing more specific differences). They usually show variables that can be counted (e.g. barrels, dollars or people), rather than a calculated rate or percentage.
- Column chart: One of the most common ways to compare the size of things. The axis should always start at 0.
- Marimekko chart: Ideal for showing the size and proportion of data at the same time, and as long as the data is not too complex.
Part of a whole
These types of numerical combinations are useful to show how an entity itself can be broken down into its constituent elements. For example, it is common to use part of a whole to represent the allocation of budgets or election results.
- Pie chart: One of the most common charts to show partial or complete data. Keep in mind that it is not easy to accurately compare the size of different segments.
- Stacked Venn: Limited to schematic representations to show interrelationships or coincidences.
Spatial
This type of graph is used when precise locations or geographic patterns in the data are more important to the reader than anything else. Some of the most commonly used are:
- Choropleth map: This is the standard approach to placing data on a map.
- Flow map: This is used to show movement of any kind within a single map. For example, it can be used to represent migratory movements.
By knowing the different statistical representation options, it helps to create more accurate data visualisations, which in turn to allow a more clearly conceived reality. Thus, in a context where visual information is becoming increasingly important, it is essential to develop the necessary tools so that the information contained in the data reaches the public and contributes to improving society.
Blog
Many organisations and administrations have found in open data a transformational pillar on which to exercise the strategy towards the data culture. Having access to data in a structured way is the basis for new business models, as well as for new initiatives aimed at citizens in different fields of action.
However, realising the full potential of open data requires a platform capable of making this data available to third parties while ensuring its quality, understanding, privacy and security.
In this context, the book “Designing Data Spaces”, includes a chapter by Fabian Kirstein and Vincent Bohlen, which proposes the use of the IDS-RAM architecture proposed by the International Data Spaces (IDS) for the development of open data ecosystems. It provides a proof of concept on the feasibility of the IDS architecture for public data spaces with the aim of achieving a solid foundation for building and maintaining interoperable open data ecosystems capable of addressing existing challenges.
The following is a summary of the views gathered in the chapter.
Open data ecosystems
Data spaces are ecosystems where different actors share data voluntarily and securely, following common governance, organisational, regulatory and technical mechanisms.
IDSA (International Data Spaces Association) was created in 2016, with the aim of boosting the global digital economy, through a secure and sovereign system of data exchange in which all participants can obtain the maximum value from their data. It is a coalition of more than 130 international companies with representation in more than 20 countries around the world.
Among other initiatives, it promotes an architectural reference model called IDS-RAM, which aims to facilitate the exchange of data to optimise its value, but without losing control. It offers several approaches whose applicability can be understood in the context of both private and open data, as it is based on metadata repositories for sharing information. That is, the data remain under the control of its owners and the standardised metadata are centrally managed for sharing.
The creation of data spaces brings with it a number of risks to be addressed, both from the consumer's and the provider's point of view. Data providers focus on legal compliance, through issues such as data ownership. Although common standards exist for aspects such as metadata description - the World Wide Web Consortium is no stranger to the problem and therefore proposed several years ago its Data Catalog Vocabulary (DCAT), a standard for describing data catalogues - the truth is that interoperability is sometimes far from its greatest potential. This is because there is sometimes incomplete metadata, the quality is poor, data is outdated, there are difficulties in accessing data and interoperating, and so on.
The applicability of IDS-RAM in open data environments
IDS offers an approach based on guaranteeing data sovereignty to providers, facilitating data exchange and addressing the concerns of both consumers and providers.
The concepts and technologies underlying open data and IDS-RAM are very similar. Both initiatives rely on metadata repositories to share information about the availability and accessibility of data. These repositories store metadata, without the need to transfer the actual data. Therefore, both concepts follow the principles of decentralisation and transfer of metadata to and from central information access points. The actual data remains under the control of the data publisher's infrastructure until a user requests it. In addition, the IDS information model is based on the principles of Linked Data and DCAT. This makes it a system that is easily compatible with open data portals, driving interoperability between data spaces and open data portals.
The architecture proposed by IDS is mainly based on two artefacts, a connector to data sources (Open Data Connector) and a metadata store (Open Data Broker), as shown in the following image extracted from the book "Designing Data Spaces":
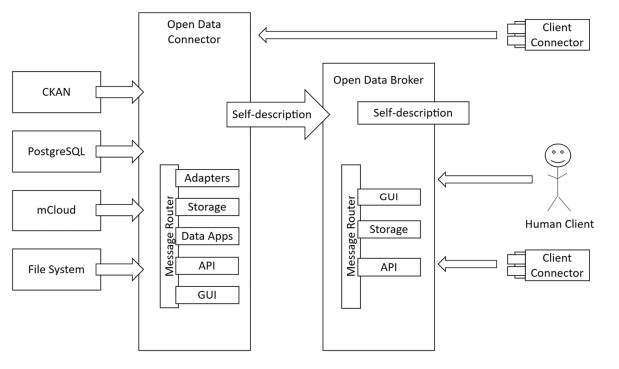
- Open Data Connector: adopts the role of open data provider. Each publishing entity applies an instance of the connector to announce availability and grant access to the data. As it is open data, and therefore public, it is not necessary to apply usage policies or restrictions as strict as in the case of other private data connectors based on this architecture, which allows for easier configuration and management a priori.
- Open Data Broker: the centralised metadata repository fulfils a similar function to that of an open data portal. From this metadata, the portal interface offers functionalities to locate and download the data from the connectors.
This management allows grouping by different application domains, i.e. centralised metadata repositories can be created for sectors such as health or tourism, as well as at municipal, regional, national or international level.
In a data ecosystem such as the one proposed by IDS, the connector informs about available or updated data, and in the metadata repository these are updated accordingly. For this purpose, communication mechanisms based on the IDS information model and the IDS Communication Protocol (IDS Communication Protocol or IDSCP) are used to announce possible changes in data availability. In this way, the availability of up-to-date data is guaranteed.
In open data portals that collect a large number of data sources, accessibility and overall usability depend on the metadata provided by the original data providers. Standards such as DCAT provide a common basis, but IDS offers more stringent specifications in the communication process.
Although it is an interesting proposal, in the context of open data, this approach has not yet been implemented in any space. However, proofs of concept have already been made, as can be seen in the Public Data Space, a showcase available since December 2020 that reproduces how the solution works. Here, connectors display the open data offerings of different data portals in Germany and are registered in a metadata repository.
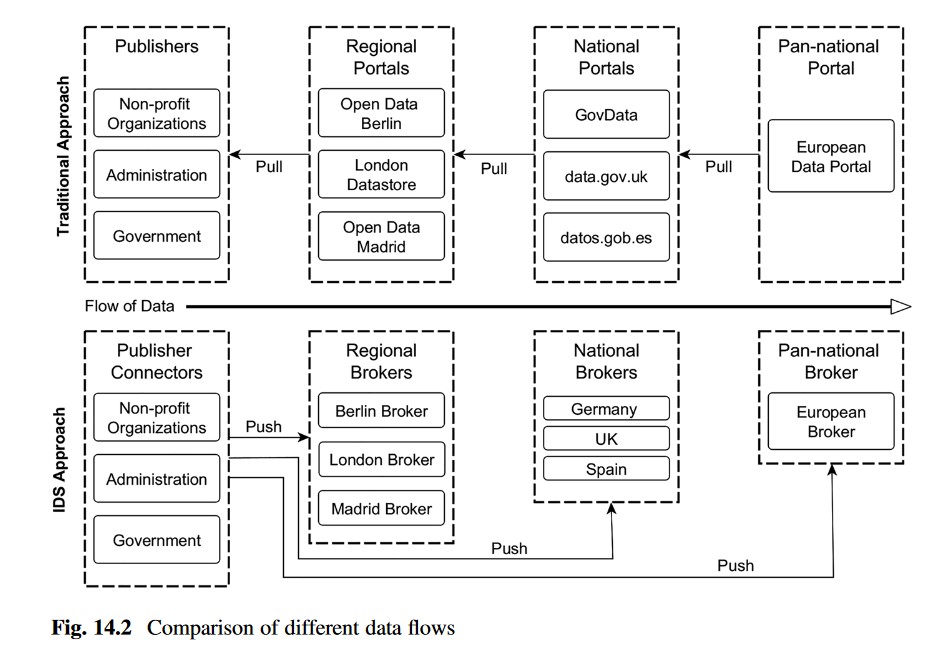
The following image shows the workflow of an IDS-RAM-based model versus a more traditional approach:
Conclusions
Open data portals provide access to open data from a variety of providers. The overall usability of these portals depends to some extent on the discoverability of the data, which in turn depends on the quality of their metadata.
To counteract the problems of unavailable data or dead links that sometimes occur in open data environments, portals periodically collect the publisher's data catalogues and perform availability checks. In the IDS-RAM-based open data ecosystem, the connector informs the broker about available or updated datasets. The 'pull' accountability approach that is common in the typical open data environments is reversed to a 'push' approach in the IDS ecosystem. This approach focuses on the responsibility of the publisher to maintain the data supply and also presents new possibilities to control its dissemination. Using IDS-RAM, the publisher chooses which metadata broker it signs up to, giving it greater sovereignty over their data.
For data consumers, this approach can lead to improvements in terms of the ability to find data in a timely manner and reduces fragmentation. Moreover, if open data can be acquired, managed and processed with the same tools and applications that are already applied in industry, the possibilities for integration and reuse multiply.
Content prepared by Juan Mañes, expert in Data Governance, with contributions from the Data Office.
The contents and views expressed in this publication are the sole responsibility of the author.
Blog
The data economy represents a huge business opportunity for companies of all sizes and sectors. According to European Commission estimates, the Data Economy will be worth €829 billion in 2025 for the 27 member states. But for the data economy to develop properly, structures are needed to facilitate the exchange of data and, with it, the development of business models based on its exploration and exploitation.
Data spaces fulfil this function by facilitating the development of an ecosystem where different actors share data in a voluntary and secure manner. To do so, they must follow common governance, organisational, regulatory and technical mechanisms.
One way to ensure that this is done properly is through reference models, such as the IDS-RAM (International Data Spaces Reference Architect Model), an initiative developed by the International Data Space Association and endorsed by the European Union.
What is the International Data Space Association?
IDSA (International Data Spaces Association) is a coalition currently comprised of 133 international, not-for-profit companies, which emerged in 2016 to work on the concept of data spaces and the principles that their design should follow in order to obtain value from data through sharing, based on secure, transparent and fair mechanisms for participants, which guarantee sovereignty and trust. These companies represent dozens of industry sectors and are based in 22 countries around the world.
IDSA is connected to different European initiatives, including BDVA, FIWARE and Plattform Industrie 4.0, participating in more than twenty European research projects, mainly in the Horizon 2020 programme.
IDSA's mission is to drive the global digital economy. To this end, among other things, it promotes an architectural reference model called IDS (International Data Spaces), a secure and sovereign data exchange system. The aim of this model is to standardise data exchange in such a way that participants can obtain all possible value from their information without losing control over it, setting the conditions for the use of their own data.
IDS-RAM architecture
The IDS-RAM (Reference Architecture model) is characterised by an open architecture (they publish their code as open source software), reliable and federated for cross-sector data exchange, facilitating sovereignty and interoperability.
IDS-RAM establishes a series of standardised roles and interactions through a 5-layer structure (business, functional, process, information and system) that are addressed from the perspective of security, certification and governance, as shown in the following figure.

These layers are critical to ensure the success of a data sharing initiative. Let's look at each of them based on the IDSA's own "Reference architecture model" and Planetic's "Positioning on Data Spaces" report, where IDS-RAM is analysed as a success story.
The business layer defines the different existing roles and the interaction patterns between them, including contracts and data usage policies. Specifically, there are four roles:
- Essential participant: any organisation that owns, offers or consumes data.
- Intermediary: trusted entities and intermediaries, such as brokers, clearing houses, identity providers and others.
- Service/Software Provider: companies that provide services and/or software to participants.
- Governance body: such as certification bodies, which are essential to guarantee the capabilities of organisations and generate an environment of trust. The IDS Association itself would also be included in this section.
These roles are related in an ecosystem marked by six categories of requirements, defined in the functional layer:
- Trust, achieved through identity management and user certification.
- Security and data sovereignty, which includes authentication and authorisation, usage policies, trusted communication and technical certification.
- Data Ecosystem, which includes the description of data sources, data brokering and vocabularies used for metadata.
- Standardisation and interoperability, which ensures the operability necessary for successful data exchange.
- Value-added applications, which allow data to be transformed or processed.
- Data marketisation, which covers aspects such as billing, usage restrictions, governance, etc., necessary when data sharing is done under payment models.
The process layer captures the interactions that take place within the data space, including the on-boarding of users, for which they need to acquire an identity provided by a certification body and request a data connector (a technical component to be installed) from a software provider.
identity provided by a certification body and request a data connector (a technical component to be installed) from a software provider. This layer also defines the processes required for data exchange and the publication and use of data apps.
The information layer explains the information model and the common vocabulary to be used to facilitate compatibility and interoperability, so that data exchange can be automated. A proprietary ontology based on an RDF schema is used for its definition.
Finally, the system layer assigns a concrete architecture of data and services to each role in order to guarantee functional requirements.
All these abstractions of layers and perspectives enable the exchange of data between data providers and data consumers, using the appropriate software connectors, accessing the metadata broker where data catalogues and their conditions of use are specified, with the possibility of deploying applications for data processing and keeping track of the transactions carried out (clearing house), all of this guaranteeing the identity of the participants.
Ultimately, it is a functional framework that provides a governance framework for secure and reliable interoperability and an open software architecture to ensure maximum adoption. In this sense, the IDSA has set itself the following objectives:
- Establish the IDS model (RAM) as the international standard for data exchange in the economy of the future.
- Evolve this reference model according to use cases.
- Develop and evolve an adoption strategy for the model.
- Support its deployment based on certifiable software solutions and commercial models.
This standard is already being used by many companies as diverse as Deutsche Telekom, IBM or Volkswagen.
The role of IDS-RAM in Gaia-X and the European Data Strategy
The IDS reference architecture model is part of the initiatives deployed within the overall framework of the EU data strategy.
Through various initiatives, the European Commission seeks to promote and interconnect data spaces in order to foster the consultation, sharing and cross-exploitation of available data, while ensuring their privacy. It is in this framework that Gaia-X has been launched, an European private sector initiative for the creation of an open, federated and interoperable data infrastructure, built on the values of digital sovereignty and data availability, and the promotion of the data economy.
The IDSA association, promoter of the IDS reference architecture, is actively participating in Gaia-X, so that the initiatives currently underway to develop reference models and implementations for data sharing with sovereignty and trust can be brought together in a de facto open standard.
Content prepared by the datos.gob.es team.