10 posts found
How to measure carbon footprint using open data
The carbon footprint is a key indicator for understanding the environmental impact of our actions. It measures the amount of greenhouse gas emissions released into the atmosphere as a result of human activities, most notably the burning of fossil fuels such as oil, natural gas and coal. These gases,…

What is the value of open geographic data?
Geographic data allow us to learn about the world around us. From locating optimal travel routes to monitoring natural ecosystems, from urban planning and development to emergency management, geographic data has great potential to drive development and efficiency in multiple economic and social area…

Accelerating the energy transition with open data
Aspects as relevant to our society as environmental sustainability, climate change mitigation or energy security have led to the energy transition taking on a very important role in the daily lives of nations, private and public organisations, and even in our daily lives as citizens of the world. Th…

The second edition of Asedie's top 3, available in seven autonomous communities
The Multisectorial Association of Information (ASEDIE), which brings together the infomediary companies of our country, once again includes among its annual objectives the promotion of the reuse of public and private information. Thus, and almost in parallel to the beginning of the new year, last De…

Artificial Intelligence applied to the identification and classification of diseases detected by radiodiagnosis
In this post we have described step-by-step a data science exercise in which we try to train a deep learning model with a view to automatically classifying medical images of healthy and sick people.
Diagnostic imaging has been around for many years in the hospitals of develo…

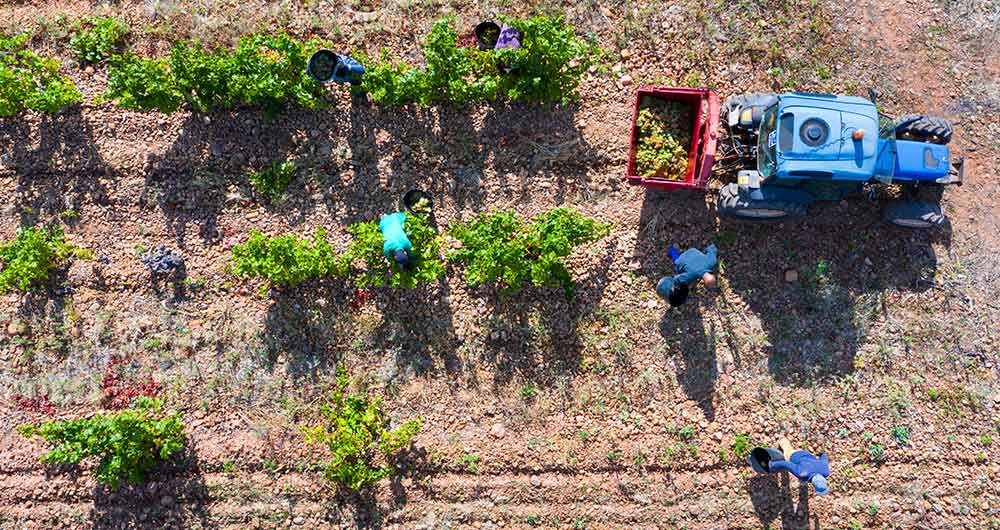
The benefits of open data in the agriculture and forestry sector: the case of Fruktia and Arbaria
As in other industries, digital transformation is helping to change the way the agriculture and forestry sector operates. Combining technologies such as geolocation or artificial intelligence and using open datasets to develop new precision tools is transforming agriculture into an increasingly tech…
Different approaches to identifying high-value data
Since the publication of Directive (EU) 2019/1024 on open data and re-use of public sector information, the European Commission is undertaking a number of actions to develop the concept of high-value data that this directive introduced as an important novelty in June 2019.
We recall that high-value…

Low coding tools for data analysis
The democratisation of technology in all areas is an unstoppable trend. With the spread of smartphones and Internet access, an increasing number of people can access high-tech products and services without having to resort to advanced knowledge or specialists. The world of data is no stranger to thi…

4 examples of harmonisation of datasets
In any project related to data, it is common to have different sources of information. Data is key for companies and public administrations, in decision making or as a basis for the implementation of projects, services or products. But if these data sources display information in a heterogeneous way…
What is an interactive display? Here is an example
The visual representation of data helps our brain to digest large amounts of information quickly and easily. Interactive visualizations make it easier for non-experts to analyze complex situations represented as data.
As we introduced in our last post on this topic, graphical data visualization is a…
