8 posts found
OGP's assessment and challenges ahead of the forthcoming Global Summit in Spain
The international open government community is preparing for the 9th Global Summit of the Open Government Partnership (OGP), which will take place in Vitoria-Gasteiz next October.. For three days, government representatives, civil society leaders and policy makers from around the world will exchange…

What data governance should look like in open source AI models
Open source artificial intelligence (AI) is an opportunity to democratise innovation and avoid the concentration of power in the technology industry. However, their development is highly dependent on the availability of high quality datasets and the implementation of robust data governance framework…

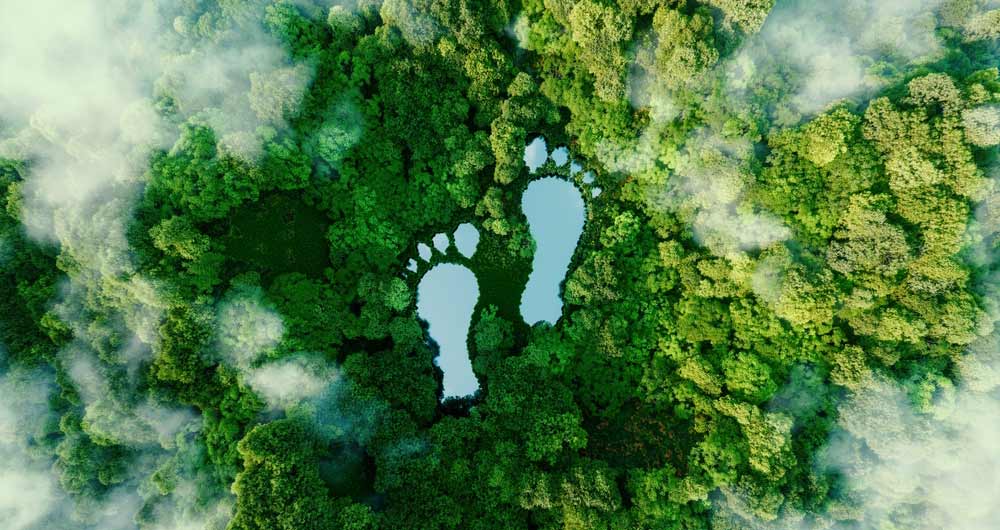
How to measure carbon footprint using open data
The carbon footprint is a key indicator for understanding the environmental impact of our actions. It measures the amount of greenhouse gas emissions released into the atmosphere as a result of human activities, most notably the burning of fossil fuels such as oil, natural gas and coal. These gases,…
Big Data Test Infrastructure: A free environment for public administrations to experiment with open data
The Big Data Test Infrastructure (BDTI) is a tool funded by the European Digital Agenda, which enables public administrations to perform analysis with open data and open source tools in order to drive innovation.
This free-to-use, cloud-based tool was created in 2019 to accelerate d…

Accelerating the energy transition with open data
Aspects as relevant to our society as environmental sustainability, climate change mitigation or energy security have led to the energy transition taking on a very important role in the daily lives of nations, private and public organisations, and even in our daily lives as citizens of the world. Th…

Data visualization: the best charts for representing comparisons
Data is a valuable source of knowledge for society. Public commitment to achieving data openness, public-private collaboration on data, and the development of applications with open data are actions that are part of the data economy, which seeks the innovative, ethical, and practical use of data to…

How to choose the right chart to visualise open data
A statistical graph is a visual representation designed to contain a series of data whose objective is to highlight a specific part of the reality. However, organising a set of data in an informative way is not an easy task, especially, if we want to capture the viewer’s attention and to present the…

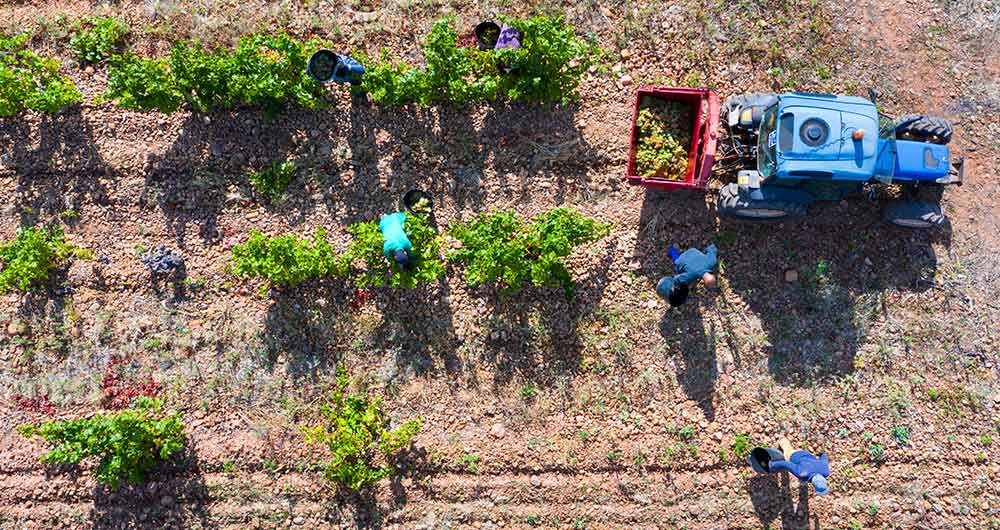
The benefits of open data in the agriculture and forestry sector: the case of Fruktia and Arbaria
As in other industries, digital transformation is helping to change the way the agriculture and forestry sector operates. Combining technologies such as geolocation or artificial intelligence and using open datasets to develop new precision tools is transforming agriculture into an increasingly tech…